
_1745823981883.webp)

SWRO Membrane Performance: Key Factors to Monitor
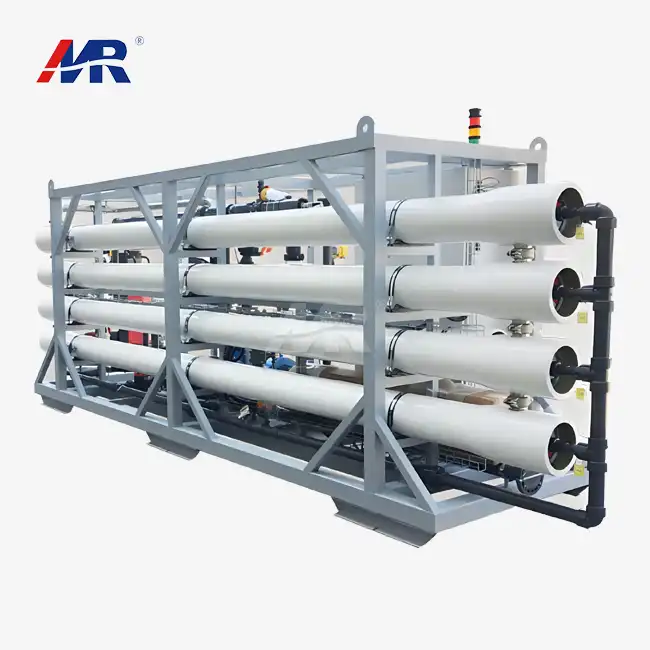
Monitoring membrane/8040-seawater-reverse-osmosis-membrane">SWro membrane performance is not optional — it is the backbone of any reliable seawater desalination system. A seawater reverse osmosis membrane operates under extreme pressure (typically 5.5–7 MPa) to strip dissolved salts from ocean water, delivering permeate that meets strict industrial and municipal standards. Unlike standard brackish water RO membranes, an SWRO membrane must sustain a salt rejection rate of 99.5% or higher while managing high osmotic pressure, variable feed water chemistry, and biological fouling risk. Understanding which performance factors to track directly determines whether your system runs efficiently — or becomes a costly liability.
Understanding SWRO Membrane Performance
What Makes SWRO Technology Different from Conventional RO?
Total dissolved solids (TDS) in seawater are between 30,000 and 45,000 mg/L, which is about ten times more than in salty water. At those concentrations, regular RO membranes just can't provide enough rejection force. SWRO membranes are made with a polyester backing web, a polysulfone microporous support layer, and a selected polyamide top layer. This three-layer structure is designed to last even when it is used continuously under high pressure.
The salt rejection rate, the permeate flux (measured in GPD), the normalized pressure differential, and the recovery rate are some of the most important performance parameters that show how well a membrane works. These measures can be used in a wide range of deployment situations, such as big desalination plants for cities, oil and gas boats at sea, the production of water fit for pharmaceutical use, coastal power plants, and activities on remote islands where system downtime is not an option.
Key Factors Impacting SWRO Membrane Performance
Feed Water Quality and Pretreatment
The quality of the feed water may be the most important factor in determining the long-term health of the membrane. Over time, organic matter, sand, suspended solids, and chlorine that is still in the membrane all weaken it. According to the IDA Desalination Yearbook (2022), over 70% of membrane breakdowns in saltwater desalination projects happen because the pretreatment wasn't done right.
Coagulation, multimedia filtration, and 5-micron cartridge filtration are common effective pretreatment steps. Before the feed water hits the barrier, the Silt Density Index (SDI) should stay below 3. When there is a lot of biofouling, like in warm coastal intake zones, UV cleaning or biocide dosing is needed.
Operating Parameters: Pressure, Temperature, and Recovery Rate
Three working factors directly affect the quality of the SWRO membrane's output and how long it lasts. In real life, each one matters in the following ways:
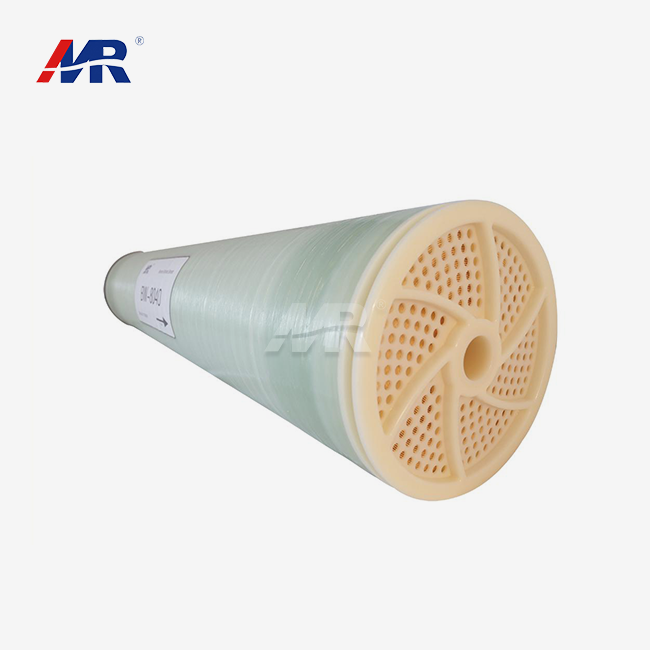
- Operating pressure has to stay within the rated range of the SWRO membrane. The working pressure range for the Morui MR-SW-4040 type is 5.5 to 7 MPa. It has an active membrane area of 7.9 m² and a permeate flow of 1,400 GPD. It also has a salt rejection rate of 99.5%. Long-term over-pressurization speeds up compression and causes flux loss that can't be reversed.
- Temperature changes both osmotic pressure and membrane permeability. If the temperature of the feed water goes up by 1°C, the permeate flux goes up by about 2–3%, but salt rejection goes down a little. Operators who have to deal with yearly changes in the temperature of seawater must change the working pressure to keep the quality of the product water stable.
- Recovery rate is the amount of feed water that is turned into permeate. Too much recovery in seawater systems concentrates scaling ions, mostly calcium carbonate and barium sulfate, on the membrane surface, causing damage that can't be fixed.
These three factors affect each other. Changing one without taking the others into account leads to unstable performance that gets worse over time and can be measured.
Membrane Fouling and Scaling: Types and Prevention
Fouling is the buildup of stuff on or inside barrier surfaces over time. There are four different types of fouling: biofouling (microbial colonies), colloidal fouling (fine particles), organic fouling (humic acids and hydrocarbons), and inorganic scaling (mineral precipitation). To clean each type, you need to use a different set of chemicals. Biofouling can be treated with biocides, but carbonate scaling needs to be cleaned with solutions of citric acid or hydrochloric acid that have pH levels carefully controlled.
Keeping the SDI below 3, using antiscalant dosing systems before the membrane array, and doing regular Cleaning-in-Place (CIP) cycles—every 3 to 6 months under normal operating conditions or right away if salt rejection drops by more than 10% from baseline—are all ways to stop problems before they happen.
Monitoring and Evaluating SWRO Membrane Performance
Which KPIs Should Engineers Track Daily?
Monitoring performance on a regular basis turns raw practical data into choices that can be put into action. These are the four most important KPIs for any SWRO system:
- Normalized salt rejection rate—shows how well ions are removed when temperature and pressure changes are taken into account
- Normalized permeate flux—finds small amounts of fouling before they get bad
- Differential pressure—a rise in the pressure drop across a membrane part — means that scale or fouling is building up.
- Recovery rate—checked against design specs to keep concentrate-side scaling from happening
More and more, SCADA-based automation platforms, inline conductivity sensors, and real-time remote monitoring dashboards are used in modern SWRO installations. With these tools, you can do preventative maintenance instead of reactive repairs, which raises the cost of doing business. The American Membrane Technology Association (AMTA) says that sites that use automated performance tracking can cut down on unplanned downtime by as much as 40%.
Comparison of SWRO Membrane with Other Membrane Technologies
Finding the right swro membrane technology means matching the filter ability to the chemistry of the water source and the purpose of the membrane. The following table shows an organized comparison of the most popular types of SWRO membranes used to treat water in businesses and cities:
| Parameter | SWRO Membrane | Brackish RO | Nanofiltration (NF) | Ultrafiltration (UF) |
|---|---|---|---|---|
| Operating Pressure | 5.5–7 MPa | 1–3 MPa | 0.5–2 MPa | 0.1–0.5 MPa |
| Salt Rejection | ≥99.5% | 95–99% | 60–80% | <5% |
| TDS Feed Range | 30,000–45,000 mg/L | 1,000–10,000 mg/L | 500–2,000 mg/L | Suspended solids |
| Primary Application | Seawater desalination | Brackish/industrial water | Softening, color removal | Pretreatment, MBR |
| Energy Consumption | High | Moderate | Low–Moderate | Low |
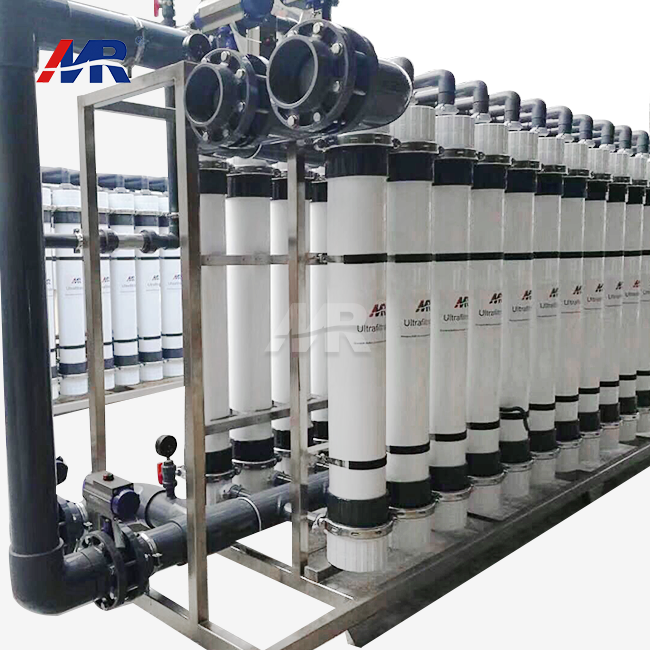
SWRO membranes use more energy than NF or UF technologies, but they are still the only choice when the TDS of the feed water is more than 10,000 mg/L. This level of salt rejection is a must for places that make medicines, work with electronics, and power plants near the coast. On the other hand, uf membranes work best as pretreatment parts because they get rid of suspended solids before the feed water gets to the SWRO array. This directly increases the service life of the SWRO membrane.
Procurement Tips: Choosing and Buying SWRO Membranes
What Should Purchasing Managers Evaluate Before Placing an Order?
Finding SWRO membranes for use on a large scale in industry takes more than just comparing prices. Credibility of the supplier, product certification, and expert help after the sale are all just as important as unit cost. Here are the main rating factors that people who work in procurement should use:
- Verified salt rejection data—Ask for standard test results under ISO or ASTM conditions instead of marketing guesses. At its recommended working pressure, the MR-SW-4040 has been shown to reject 99.5% of salt.
- Material traceability—Make sure you know what the polyamide layer is made of and what the fiber support requirements are. These directly affect how well the membrane can handle chemicals, how often it needs to be cleaned, and how long it lasts.
- Warranty and replacement terms—Make sure you know if the supplier covers performance loss within a certain operational period and what conditions make the warranty null and void.
- Bulk pricing and logistics—When you place a big project order, talk about the wait times, freight terms, and volume pricing tiers. Suppliers that can make membranes in-house can offer faster wait times and more consistent quality.
Hiring a provider that also does installation, testing, and Technical support after the installation is complete greatly lowers the risk of the project. This is especially true for large, remote, or offshore city projects where field support logistics are tricky.
Conclusion
To keep the SWRO membrane working at its best, you need to pay close attention to four areas that are all connected: pretreatment of the feed water, control of operating parameters, proactive fouling management, and data-driven monitoring. If you put a membrane into service in the best possible conditions—with the right SDI management, the right operating pressure, and regular CIP scheduling—it can keep rejecting salt well and giving you the same permeate output for years. Anywhere you cut costs, you lose speed, which adds up and lowers your return on investment over time. Monitoring membrane performance should be seen as an ongoing engineering field, not something that needs to be checked off every so often.
FAQ
1. How often should SWRO membranes be replaced?
How long a membrane lasts depends a lot on the quality of the feed water, the operating conditions, and how well it is maintained. If you take good care of your SWRO membranes, they should last for 5 to 7 years. If normalized salt rejection drops by more than 10–15% from baseline, or if cleaning can't bring back permeate flow, the filter needs to be replaced.
2. How is an SWRO membrane different from a standard RO membrane?
Normal RO membranes for brackish water work at 1–3 MPa and can handle TDS levels below 10,000 mg/L. SWRO membranes are designed to work with saltwater TDS levels of up to 45,000 mg/L, requiring working pressures of 5.5–7 MPa and salt rejection rates of 99.5% or higher, which is a very different range of performance requirements.
3. What is the most effective way to prevent biofouling?
The first step in stopping biofouling is treating the feed water with a biocide (carefully chosen to avoid damaging the membrane) and UV light when chlorine can't be used. This is done to keep the SDI below 3. Regular CIP cycles with approved biocidal cleaners stop microbes from colonizing before biofilm forms.
4. Can SWRO membranes handle fluctuating feed water salinity?
Yes, as long as they don't go beyond what was planned. Changes in salinity that happen with the seasons are standard in ocean intakes, and workers should make the necessary changes to the feed pressure. Long-lasting salt levels above the recommended TDS limits raise the need for energy and speed up membrane aging.
Partner with Morui for Certified SWRO Membrane Solutions
Morui offers industrial-grade seawater reverse osmosis membranes, such as the MR-SW-4040, which reject 99.5% of salt and produce 1,400 GPD. They also make the membranes themselves and provide on-site help for activation. Our engineering team is ready to help you whether you are looking to expand a local desalination plant or find long-term industry projects that need partnerships with swro membrane suppliers. To get an estimate or a group quote, email us at benson@guangdongmorui.com.
References
1. International Desalination Association (IDA). IDA Desalination Yearbook 2022–2023. Media Analytics Ltd., 2022.
2. American Membrane Technology Association (AMTA). Membrane Technology for Water and Wastewater Treatment. AMTA, 2021.
3. Elimelech, M., & Phillip, W. A. "The Future of Seawater Desalination: Energy, Technology, and the Environment." Science, 2011.
4. Fritzmann, C., Löwenberg, J., Wintgens, T., & Melin, T. "State-of-the-Art of Reverse Osmosis Desalination." Desalination, 2007.
5. Al-Karaghouli, A., & Kazmerski, L. L. "Energy Consumption and Water Production Cost of Conventional and Renewable-Energy-Powered Desalination Processes." Renewable and Sustainable Energy Reviews, 2013.
6. Greenlee, L. F., Lawler, D. F., Freeman, B. D., Marrot, B., & Moulin, P. "Reverse Osmosis Desalination: Water Sources, Technology, and Today's Challenges." Water Research, 2009.