
_1745823981883.webp)

RO Equipment vs Nanofiltration: Which Fits Your Process?
Choosing the correct membrane filtration technology helps your organization comply with regulations and save expenses. RO equipment or nanofiltration systems? Reverse osmosis removes 99.5% dissolved solids. It is necessary for pharmaceutical-grade water and other high-purity uses. Nanofiltration lets monovalent ions pass but targets divalent ions and larger organic compounds. This process is between RO and ultrafiltration. This decision will affect your energy consumption, maintenance, and capital investment costs for years to come.
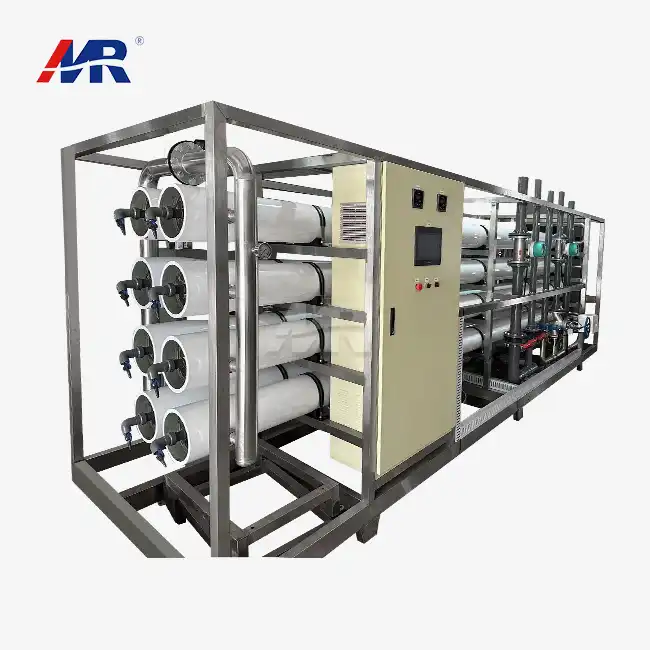
Introduction
Membrane separation has transformed water treatment in pharmaceutical, culinary, electronics, and municipal utility companies. The two methods of water purification, reverse osmosis and nanofiltration, address distinct issues. The burden on procurement managers to reconcile purity criteria and operational efficiency is growing. Technical decision-makers must also ensure equipment performs dependably when feed water conditions vary. This comparison considers performance metrics, pricing, maintenance, and scalability elements that affect project feasibility. Planning new setups or changing existing ones requires understanding membrane technology. It prevents expensive errors when matching RO equipment to process needs.
Understanding RO Equipment and Nanofiltration Technology
How Reverse Osmosis Systems Operate
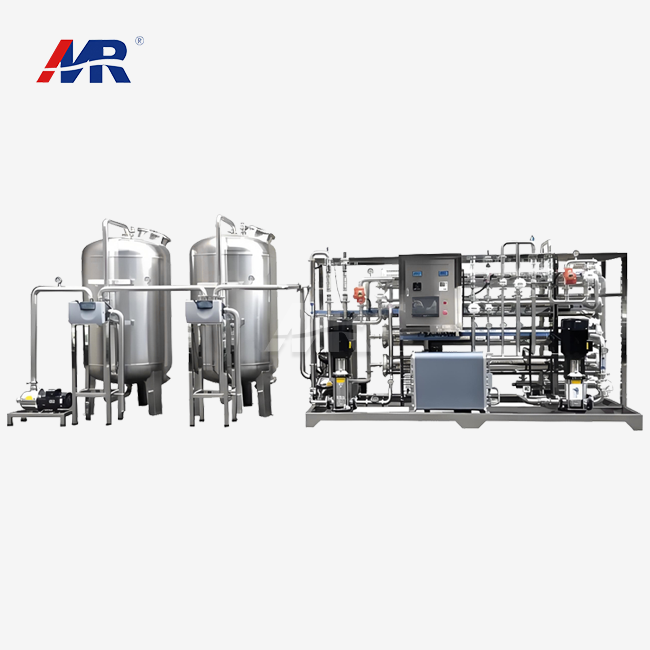
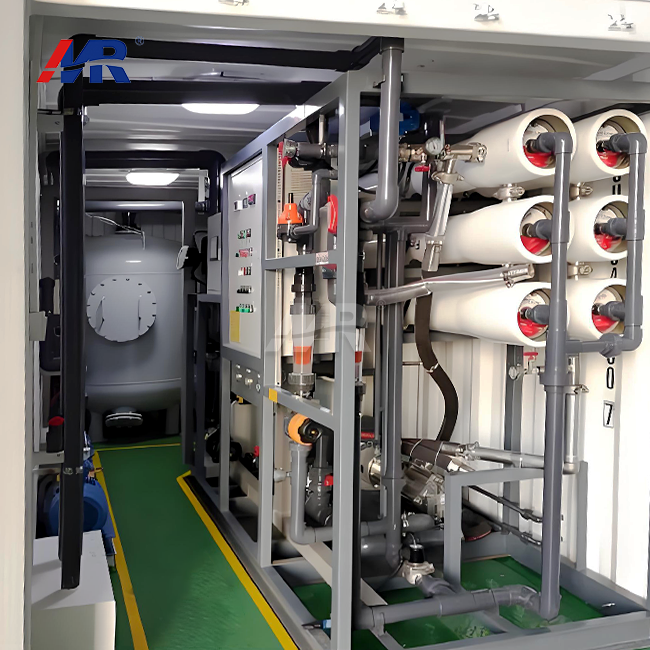
Using 10–16 bar pressure, reverse osmosis devices force water through semi-permeable membranes having 0.0001 micron holes. Aromatic polyamide thin-film composite membranes block dissolved salts, heavy metals, bacteria, viruses, and organic compounds. Permeate water with TDS levels below 10 mg/L is produced from feed water with up to 10,000 mg/L by rejecting at least 99% of the water. This makes RO the greatest option to desalinate saltwater, manufacture ultrapure semiconductor water, and utilize burner feed water in power plants.
Nanofiltration Membrane Characteristics
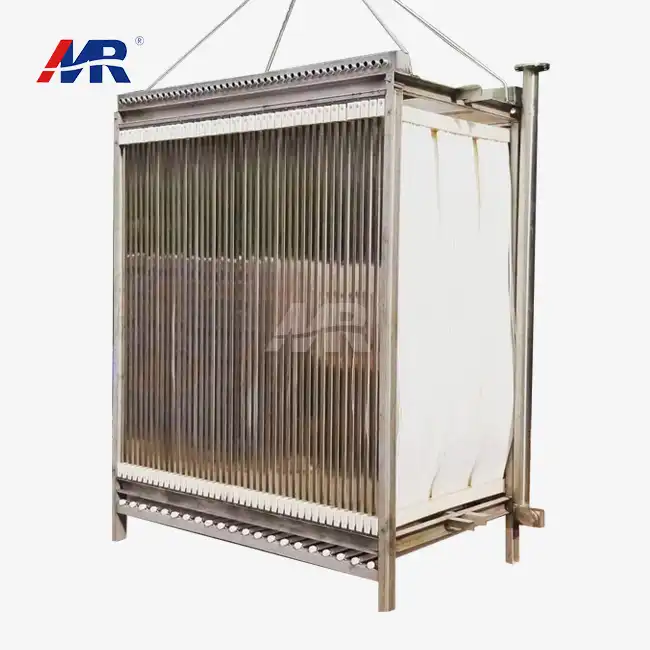
The holes of nanofiltration membranes are 0.001–0.01 microns larger. This creates a charge-based separation mechanism and size exclusion. These membranes effectively block multivalent ions like calcium, magnesium, and sulphate while partly allowing monovalent ions like sodium and chloride. Lower working pressures of 5 to 12 bar are required because selective permeability decreases hardness and organic matter without demineralizing the rock. This approach may soften water, remove color from wastewater, and be used in other instances where preserving certain minerals enhances product quality or decreases treatment costs.
Industry Applications and Water Quality Standards
Pharmaceutical businesses employ RO equipment to ensure their water passes USP requirements. RO removes harmful germs from food and drink goods, preserving flavor and shelf life. The dairy sector concentrates whey, the textile business removes colors from wastewater, and drinking water facilities target pollutants while retaining vital minerals via nanofiltration. Municipal utilities are increasingly using nanofiltration to clean public water, prioritizing organic carbon and pathogens above minerals.
Key Factors for Choosing Between RO Equipment and Nanofiltration
Water Quality Objectives Drive Technology Selection
The water requirements you seek determine the optimum technology for your operation. RO systems reject water when TDS levels must be below 50 mg/L or monovalent salts must be eliminated. Nanofiltration's selective separation is effective for reducing CaCO3 hardness to under 50 mg/L while maintaining moderate conductivity values (200-800 μS/cm). Consider how sensitive downstream equipment is to dissolved minerals. Boilers and high-pressure steam generators require RO-treated water, although cooling towers may use nanofiltration permeate.
Energy Consumption and Operating Pressure Requirements
Nanofiltration recovers more water and consumes 30–50% less energy than reverse osmosis due to lower transmembrane pressure. An NF system may recover 85–90% of input water, whereas a RO system may recover 75%. This saves energy and money on pressurization and concentrate removal. Nanofiltration rejection rates decline significantly when feed water salt levels are above 3,000 mg/L TDS, reducing these savings. True feed water analysis in energy audits can determine whether pressure differences save water chemistry.
Membrane Fouling Susceptibility and Cleaning Protocols
In both systems, suspended particles, organic matter, and scaling chemicals produce fouling, but they handle it differently. ro membranes require more frequent cleaning with acidic and alkaline solutions due to biological fouling. Nanofiltration membranes can tolerate greater organic loading and are chemically more stable from pH 3 to 11. The frequency of system cleaning affects labor, chemical, and downtime expenses. Test the fouling potential of your feedwater in jars or trial studies to prevent underestimating post-installation maintenance.
Installation Complexity and Footprint Considerations
Modern reverse osmosis systems are modular, allowing capacity to increase as demand grows. A tiny 10,000-GPD RO machine uses roughly 50–70% less space than standard treatment trains with the same purity. Vertically mounted nanofiltration devices function better, but their lower flux rates need larger membrane surfaces to achieve the same flow rates. Different pre-treatments need different things. RO requires tighter turbidity control below 1 NTU and SDI below 3, whereas nanofiltration can tolerate more suspended particles. Upstream filtration equipment size and cost depend on these parameters.
Comparative Analysis: RO Equipment vs Nanofiltration in Industrial Applications
Contaminant Rejection Performance Metrics
Tests in the lab show that RO equipment consistently rejects 95–99.5% of sodium chloride, 98–99% of calcium and magnesium hardness, and almost all bacteria, viruses, and particles bigger than 0.001 microns. Nanofiltration can get rid of 85–95% of divalent salts but only 40–70% of monovalent salts, which makes the separation profiles different. The molecular weight affects how well an organic compound is removed. NF blocks molecules above 200–400 Daltons, while RO gets rid of compounds below 100 Daltons. When treating feed water that is polluted with certain chemicals like PFAS, heavy metals, or agricultural pesticides, these differences in performance become very important.
System Capacity and Scalability Across Industries
Our high-tech membrane systems can handle capacities ranging from 1,000 GPD for lab use to 100,000 GPD for large-scale operations in factories. Recovery rates of up to 75% in RO configurations reduce the amount of concentrate that needs to be thrown away, which helps with environmental compliance issues. Nanofiltration devices that treat public water with lower salinity usually get 90% recovery, which means that a lot less raw water needs to be taken in. When planning for future growth, scalability is important. Module-based designs let you add membrane vessels at the same time without having to rethink hydraulic systems or control structures. This protects your initial investments while allowing for growth.
Membrane Lifespan and Performance Degradation Patterns
If you take good care of your RO membranes, they should last between 3 and 5 years before they need to be replaced because the flux drops or the salt passage increases. Because lower operating pressures slow down the rate of compaction, nanofiltration membranes usually last between 5 and 7 years in similar conditions. Monitoring normalised permeate flow and conductivity shows that performance is slowly getting worse, which lets you plan ahead for maintenance. The type of water source has a big effect on how long something lasts. For example, groundwater with stable chemistry lasts longer than surface water, whose quality changes seasonally and whose organic matter levels rise and fall. Using automatic CIP systems with the best chemical processes protects membrane integrity and extends the life of the system.
Real-World Case Studies Demonstrating Technology Fit
A drug company in New Jersey changed old mixed-bed deionisation equipment to RO equipment. This cut the cost of renewal chemicals by 85% while still meeting USP conductivity standards of less than 1.3 µS/cm. The 99.7% rejection rate of the method got rid of the need for polishing further down the line. On the other hand, a Florida local utility chose nanofiltration to get rid of colour and dissolved organic carbon from surface water while keeping pH to prevent corrosion in the distribution system. Compared to RO alternatives, the NF system got rid of 70% of the colour while using 40% less energy. These Cases show how matching the right technology to the right contaminant targets improves both technical performance and economic results.
Cost and Procurement Insights for RO and Nanofiltration Systems
Capital Investment and Total Cost of Ownership
Industrial RO systems can cost anywhere from $30,000 to $500,000 for the initial equipment, based on the system's capacity, amount of automation, and building materials. Nanofiltration systems that are similar usually cost 10–20% less because they don't need as many pressure pumps and have simpler hydraulic designs. But when you figure out the total cost of ownership, you have to include the cost of replacing the membranes. RO membranes cost between $800 and $2,000 per element, while NF elements cost between $600 and $1,500. Differences in how much energy a system uses add up to a lot over 10 years of use. If the facilities that process 50,000 GPD of water use $0.12/kWh energy rates and the same number of hours, they might spend $15,000 to $25,000 a year on RO and $10,000 to $18,000 on nanofiltration.
Evaluating Supplier Credentials and Support Infrastructure
Working with well-known companies guarantees access to tried-and-true membrane technology and quick expert help. We have more than 500 employees, and 20 of them are specialised engineers who can do thorough water audits, system sizing calculations, and pilot testing programs. Our factory that makes membranes guarantees consistent quality, and our partnerships with top component brands, such as Shimge water pumps, Runxin valves, and Createc instruments, give us access to reliable extra equipment. Professionals in procurement should check that the supplier has the right Certifications, read over the warranty terms that cover performance guarantees for membranes, and find out about after-sales service options, such as emergency response times and where to find spare parts.
Maintenance Cost Projections and Service Requirements
For systems that were built correctly, annual maintenance costs usually make up 3 to 5 percent of the capital costs. Replacement of pre-filter cartridges every one to three months costs $50 to $200 per set. Cleaning chemicals cost an average of $1,000 to $3,000 per year, and tracking tools need to be calibrated on a regular basis. Here are the main benefits of lowering long-term maintenance costs:
- Automated control systems constantly check performance factors like differential pressure, conductivity, and flow rates. They start cleaning cycles before serious fouling happens and increase the time between membrane service intervals.
- Modular construction enables technicians to separate individual membrane vessels for repair without having to shut down the whole system. This means that production can continue while service processes are being done.
- Energy-efficient designs incorporating variable frequency drives make it easier for pumps to work with changing demand profiles, which cuts down on both mechanical wear and electrical use.
- High-quality components manufactured to international standards minimize unexpected failures, with a mean time between failures exceeding 50,000 hours for critical rotating equipment.
When compared to older systems, these benefits cut unexpected downtime by 60–70%, protecting production plans and keeping product quality consistent. Using predictive analytics and condition-based actions in strategic maintenance planning helps keep spare parts inventories at their best and stops major breakdowns from happening.
Making Your Decision: Which Technology Best Fits Your Process?
Decision Framework for Technology Selection
To start, you should do a full analysis of your feedwater to find out its pH, TDS, hardness, alkalinity, silica, iron, manganese, and organic content. Compare these numbers to the water standards you need for your product. This will help you figure out what gap each technology needs to fill. Figure out the preliminary recovery rates based on the amount of raw water that is available and the limits on the discharge of concentrates. Nanofiltration works best when the feed TDS is less than 2,000 mg/L, and the goal output conductivity is between 200 and 500 μS/cm. When source water has more than 3,000 mg/L TDS, or when product specs need conductivity below 50 μS/cm, reverse osmosis is needed.
Evaluating Technical Proposals and Performance Guarantees
Reliable suppliers give detailed proposals with pictures of the process flows, calculations for mass balances, and lists of equipment specifications with promised performance levels. Instead of looking at idealised lab values, carefully read the rejection rates listed on the membrane manufacturer's data sheets that are specific to your operating conditions. Ask for references from places that treat similar amounts of water with similar systems. Guarantees of performance should include permeate flow rates, rejection percentages, and recovery ratios, along with clear testing procedures to make sure they are accurate. Knowing these promises keeps disagreements from happening during commissioning and holds you responsible for reaching your water treatment goals.
Planning for Future Expansion and Process Evolution
Plan systems with 20–30% capacity headroom so that production can go up without having to buy new equipment right away. When demand rises, modular designs let you add more membrane vessels, spreading the cost of the infrastructure over several steps of growth. Think about whether new rules could make it necessary to upgrade technology because they lower the amount of waste that can be released or the requirements for Products. It's easy to improve RO equipment by replacing the membrane elements with products that have a higher rejection rate. Nanofiltration systems, on the other hand, might need to be changed to RO if future purity needs are higher than what NF can handle. By considering these possible outcomes during the original purchase, you can avoid premature decline and protect the long-term value of your investment.
Conclusion
Ultimately, the choice between reverse osmosis and nanofiltration comes down to weighing the need for purity against the cost of running the process. RO equipment gets rid of contaminants better than anything else for uses that need very pure water, and nanofiltration does a good job of selectively separating minerals when full demineralisation is not needed. A good procurement process includes a full water analysis, lifecycle cost modelling, and a supplier capability assessment to make sure that the technology fits with both current needs and plans for growth in the future. For decades to come, the choice will have an effect on production efficiency, regulatory compliance, and running costs. This is why performance data, reference sites, and support infrastructure must be carefully looked at before deciding on either technology path.
FAQ
Q1: How often do membranes require replacement in RO versus nanofiltration systems?
RO membranes usually work well for three to five years with the right pre-treatment and regular cleaning. Nanofiltration membranes, on the other hand, usually last seven to eight years because they work at lower pressures, which prevents the membrane from getting compacted. The actual lifespan depends a lot on the quality of the feed water, the number of hours it is used, and how well it is maintained. Monitoring normalised flux and salt passage trends lets replacement decisions be based on data instead of making decisions based on random schedules.
Q2: Can nanofiltration replace reverse osmosis in pharmaceutical applications?
Nanofiltration isn't a good alternative to RO when making medicines because USP standards for pure water need conductivity to be less than 1.3 µS/cm at 25°C, which can only be reached through RO or ion exchange cleaning afterward. Nanofiltration permeate usually has a conductivity of 200 to 800 μS/cm, which means it needs more treatment steps. Some facilities use NF as a pre-treatment to keep organic matter from getting stuck on RO membranes further down the line. This extends the life of the RO membranes while keeping compliance.
Q3: What energy savings does nanofiltration provide compared to reverse osmosis?
Nanofiltration uses only 1.0 to 1.5 kWh/m³, while reverse osmosis uses 1.5 to 2.5 kWh/m³ to treat the same amount of water, which is a 30–40% energy savings. These benefits come from lower operating pressures (5–12 bar for NF vs. 10–16 bar for RO) and higher recovery rates, which lower the amount that needs to be pressurised. How much you save depends on the saltiness of the feed water, the quality of the product you want to make, and system efficiency factors like how well the pump works and how resistant the membrane is to fouling.
Partner with Morui for Your Membrane Filtration Needs
Guangdong Morui Environmental Technology is ready to help you come up with the best way to treat water for your specific business needs. With 14 branch locations, dedicated engineering teams, and in-house membrane manufacturing capabilities, our extensive portfolio includes high-performance RO equipment and nanofiltration systems. We do full turnkey installations that include designing the pre-treatment process, integrating automated controls, commissioning services, and ongoing Technical support. As a reliable provider of RO equipment to the pharmaceutical, food processing, electronics, and municipal markets across the US, we combine cutting-edge membrane technology with real-world application knowledge. You can talk to our experts about your water quality problems by emailing benson@guangdongmorui.com. You'll get detailed technical plans and learn how our solutions lower running costs while still meeting regulatory requirements.
References
1. American Water Works Association (2022). Membrane Technology Research Committee Report: Comparative Analysis of Pressure-Driven Membrane Processes. AWWA Publications.
2. Crittenden, J.C., Trussell, R.R., Hand, D.W., Howe, K.J., & Tchobanoglous, G. (2021). MWH's Water Treatment: Principles and Design (4th Edition). John Wiley & Sons.
3. International Desalination Association (2023). IDA Desalination Yearbook 2022-2023: Industrial Membrane Systems Market Analysis. Media Analytics Ltd.
4. Membrane Technology and Research, Inc. (2021). Economic Analysis of Membrane Processes for Industrial Water Treatment Applications. Technical Bulletin MTR-2021-08.
5. National Research Council Water Science and Technology Board (2020). Review of the Desalination and Water Purification Technology Roadmap. National Academies Press.
6. Van der Bruggen, B., Mänttäri, M., & Nyström, M. (2022). "Comparison of Nanofiltration and Reverse Osmosis Performance in Industrial Water Treatment." Separation and Purification Technology, Volume 287, Article 120542.