

_1745823981883.webp)

Large RO System Recovery Rate Optimization Techniques
For industrial facilities looking to cut down on water waste and operational costs, optimizing recovery rates in a large RO system offers a game-changing chance. How well a reverse osmosis plant uses its input materials is directly related to its recovery rate, which is the percentage of feed water that is turned into pure permeate. By using targeted optimization techniques, facilities that handle 10,000 to 500,000 gallons per day can raise recovery rates from the normal 50–65% to 75–80% or higher, based on the feed water characteristics and the design of the system. In industrial, pharmaceutical, power generation, and municipal settings, this improvement means measurable cost savings, less damage to the environment, and longer membrane service life.
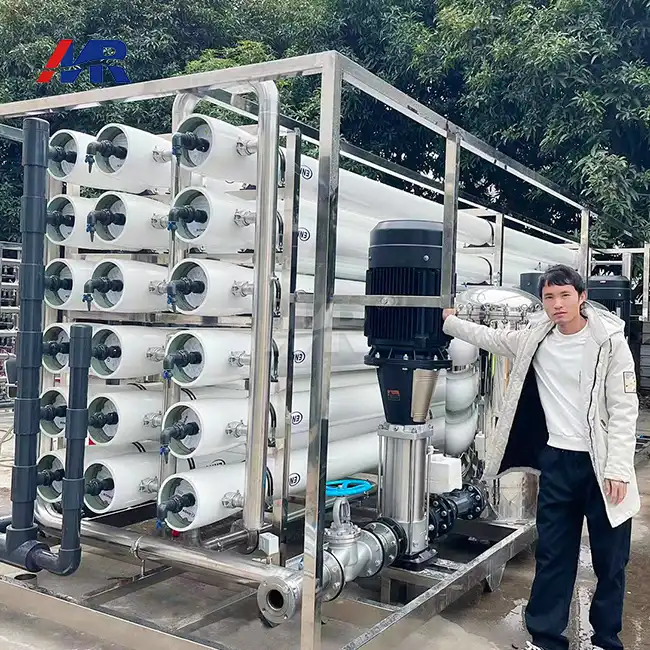
Understanding Recovery Rate in Large RO Systems
Recovery rate has a big impact on how industrial water purification operations affect the economy and the environment. When a large RO system works at 60% recovery, it means that 40% of the feed water that comes in goes out as concentrate waste, which contains valuable materials and needs to be thrown away. Increasing recovery to 75% cuts waste volume by 37.5% right away, which saves money on disposal costs and water in places where it is hard to find.
Impact on Operational Expenses and Environmental Footprint
Higher recovery rates boost facility profits. Low concentrate volume means lower discharge fees, especially in places with strict wastewater rules. Raw feed water costs less and requires less infrastructure since facilities use less of it. As permeate is extracted from each cycle, the system requires less energy per gallon of product water. This must be balanced against larger concentrations' increased osmotic pressure.
Environmental benefits go beyond water conservation. City supplies, surface water, and aquifers are less affected by less feed water intake. Less concentrated discharge makes brine removal easier, especially for non-ocean facilities. As firms commit to sustainability and obey stronger environmental standards, these aspects become increasingly significant in their purchasing decisions.
Critical System Components Influencing Recovery Performance
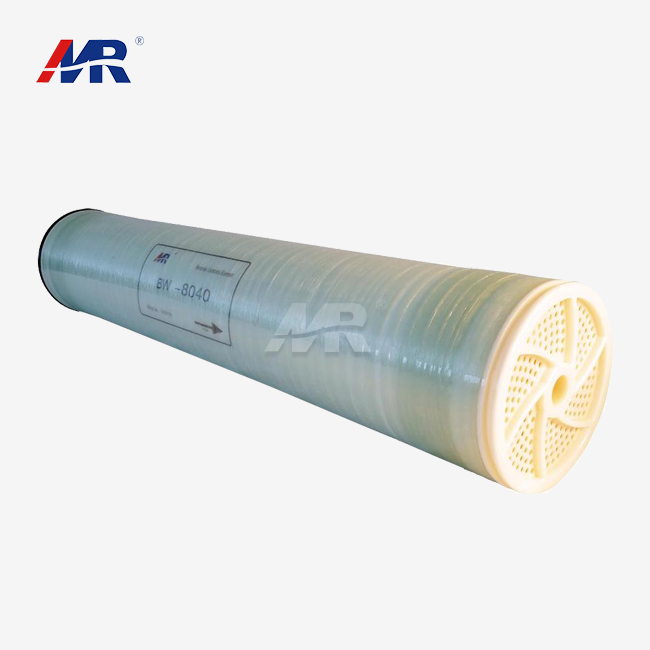
The design of industrial reverse osmosis equipment restricts recovery. Purification barriers are Hydranautics, Toray, and Dow high-flux thin-film composite membranes. Even when concentrate salinity rises, they reject 99.2% to 99.8% of salt, maintaining permeate quality. Concentration polarization—when dissolved solids build up near membrane surfaces, making recovery less effective—is affected by membrane element arrangement in ASME-certified pressure vessels.
As concentrate TDS rises, osmotic resistance grows rapidly, so high-pressure multistage pumps need high trans-membrane pressure. Energy recovery systems absorb hydraulic energy from compressed concentrate streams to reduce energy usage, making them commercially viable at greater sizes. Multimedia filters, softeners, and antiscalant dosing prevent membrane fouling and scaling, which quickly lowers recovery efficiency when feed water quality varies.
Benchmarking Recovery Values Against Industry Standards
Recovery rates vary by application and input water source. Municipal water supply with TDS below 500 mg/L can recover 75–80% when properly configured. Groundwater with 1,500–5,000 mg/L calcium sulfate and silica recovers 65–75% of its volume. Due to high osmotic pressure and membrane flow restrictions, saltwater desalination recovers 35–50% of the water.
Different uses for industrial process water. Pharmaceutical facilities that generate USP-grade purified water strive for 70–75% recovery from municipal supply, balancing water efficiency and quality. Power plant boiler feed systems may recover 80–85% with electrodeionization cleaning. A large RO system can be employed for high-volume applications requiring consistent purity. Procurement teams may set realistic performance targets and locate systems with actual optimization possibilities instead of marketing hype by understanding these benchmarks.
Identifying and Overcoming Key Bottlenecks Limiting Recovery Rate
Before optimization can work, performance hurdles must be systematically identified. Recovery rate degradation shows up in a number of ways that let operators know there are problems that need to be fixed.
Common Signs of Suboptimal Recovery
The most obvious sign of recovery deterioration is decreased normalized permeate flow. If product water production drops while maintaining operating pressure and temperature, the membrane may be blocked or scaling, reducing its usable area. Normalized salt passage, measured by permeate conductivity, rises as the membrane breaks down or the preparation fails, letting foulants through.
Biofilm formation or particle accumulation slows membrane vessel flow by increasing differential pressure. Facilities usually notice these changes over time and think the performance drop is normal with aging rather than a problem that can be fixed. Permeate production uses more energy as pumps work harder against higher resistance. This impacts operational budgets. Concentrate flow meter readings that don't meet design standards indicate recovery rate alterations that need investigation.
Major Bottlenecks: Fouling, Scaling, and Pretreatment Inadequacy
Membrane fouling involves several processes that block water flow. Membrane surfaces accumulate colloidal fouling from suspended particles and biological fouling from biofilms that devour feed water nutrients. Fouling from natural organic matter or process chemicals forms pressable gel layers. Various fouling requires various detection and repair methods.
Salts that don't dissolve entirely in concentrate streams form hard, crystalline deposits on membrane surfaces, causing scaling. The most problematic scalants are calcium carbonate, calcium sulfate, barium sulfate, and silica. Concentrate-side TDS rise causes supersaturation, tenfold scaling potential as recovery increases. The fundamental recovery ceiling for any feed water composition is established by this occurrence.
Poor surface treatment worsens fouling and scaling. Small multimedia screens let turbidity through during flow surges. Hardness can pass through improperly set up or working water softeners. High quantities of antiscalants will not remain in solution without enough dosing. Oxidation by municipal chlorine or chloramine destroys polyamide membranes irreversibly. A thorough feed water analysis and pretreatment plan can prevent these issues.
Operational Mismatches: Pressure and Flow Settings
Recovery optimization requires accurate working factor settings to fit system design. Operating pressure below design values reduces pushing force, which reduces permeate flow and return. Too much pressure wastes energy without recovery, and hydraulic shock damages membranes. Mismatches in feed flow rate affect concentrate side cross-flow velocity, the most significant element in preventing concentration polarization. Lack of cross-flow causes boundary layers, whereas too much flow loses pumping energy.
Temperature affects system performance because membrane permeability increases by 3% each degree Celsius. Facilities rarely adjust performance statistics for temperature changes, so annual changes are seen as declines. Changes in feed water pressure from common supply infrastructure make recovery unpredictable. This is especially problematic for locations without feed tanks with level controls. Fixing these operating mismatches by changing PLC programming and hydraulics can yield instant recovery gains without new equipment.
Techniques and Best Practices for Optimizing Recovery Rate in Large RO Systems
Strategic improvement of system processes leads to measurable improvements in recovery while maintaining quality standards at all levels. Structured methods that look at multiple performance dimensions at the same time are used by successful optimization programs in large RO systems.
Pretreatment Upgrades for Enhanced Membrane Protection
Advanced pretreatment methods boost membrane recovery by cleaning feed water. Ultrafiltration removes most suspended solids and colloids, lowering the Silt Density Index below 3.0. This allows more aggressive recovery than multimedia filtering. Membrane-based pretreatment rejects turbidity better during seasonal quality variations, benefiting surface water and wastewater facilities.
Choosing the correct antiscalant chemical and dosage prevents scaling at high recovery levels. Scaling agents remain in solution at larger concentrations because modern polymeric dispersants prevent crystal growth and modify their structure. Testing antiscalants in lab jars with actual feed water determines the appropriate type and dose for each scale species. Scaling indices can be monitored online using automated calculations based on conductivity, pH, and temperature to adjust dosing to feed water changes.
Automatic sodium metabisulfite dosing and chlorine tracking protect membranes from oxidation. Before exposing membranes to chlorinated municipal sources, facilities must remove residual chlorination. Activated carbon filtration is a backup, but it must be monitored for biological development and bacterial contamination. These pretreatment enhancements stabilize operational conditions for long-term high recovery.
Membrane Configuration and Operating Parameter Adjustments
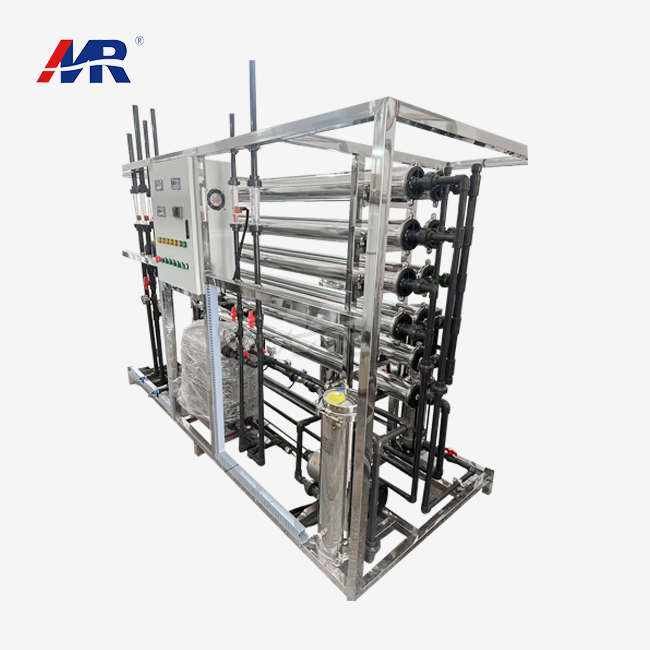
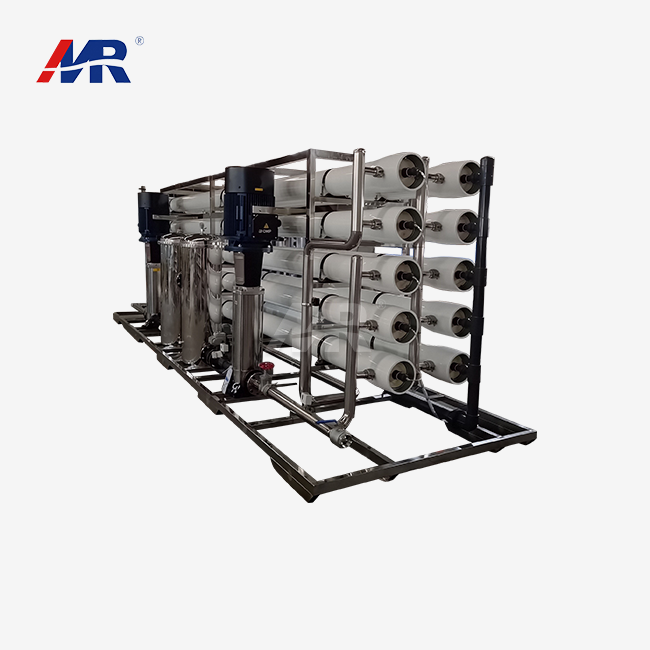
Hydraulic design and membrane staging considerably impact recovery rates. Two-stage designs with interstage boosting maintain driving pressure to sustain recovery rates 15–20% greater than single-stage designs with the same membrane area as osmotic resistance rises. The first stage concentrate feeds a second, smaller array to manage salt on the concentrate side and maximize system recovery.
Operating parameter optimization balances many factors for a large RO system. Lowering the permeate flux just below the maximum rated capacity makes the membrane last longer and less likely to clog, allowing it to recover faster over time. The membrane area is somewhat larger, but cleaning is less frequent, and replacements are longer. The system can dynamically adjust feed pressure to account for variations in feed water quality using variable frequency drives, maintaining the goal recovery rate throughout the seasons.
Tracking performance is more accurate when working statistics are corrected for temperature. Normalizing permeate flow, salt passage, and pressure drop to 25°C shows season-independent performance trends. This strategy prevents individuals from rashly cleaning or replacing a membrane based on temperature-induced breakdown.
Advanced Technologies: Monitoring, Control, and Cleaning Protocols
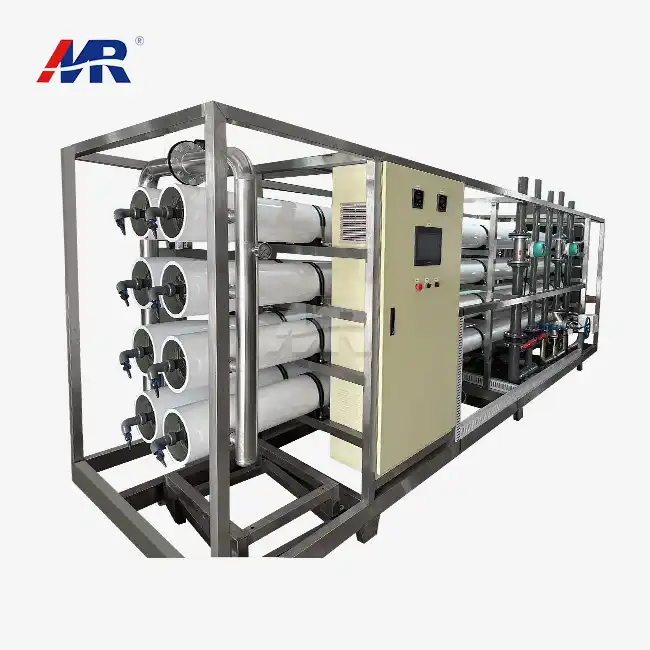
Modern programmable logic devices and human-machine interfaces enable proactive management of large reverse osmosis systems. Real-time monitoring of normalized performance metrics triggers alerts before recovery deterioration. Trend analysis shows fouling starts slowly, so preventative cleaning should be done during planned maintenance windows, not emergency shutdowns.
Automated chemical cleaners improve membrane repair. Cleaning skids with microprocessors provide precise chemical concentrations, temperatures, and contact times for different foulants. High-pH caustic eliminates organic and biological deposits, whereas low-pH acid dissolves mineral scales. Sequential cleaning removes mixed fouling and maximizes flow. Detailing cleaning records helps plan future maintenance by showing how well the intervention worked.
Online monitoring of key water quality indicators allows closed-loop regulation. Permeate and concentrate conductive sensors measure recovery rates and salt rejection in real time. Monitoring the oxidation-reduction potential ensures membrane stability against chlorine damage. Particle counters detect preparation breakthroughs before membrane fouling. These tools replace scheduled sampling with continuous verification, which detects issues immediately.
Maintenance Tips to Sustain High Recovery Rate and Prevent Common Problems
To keep recovery rates at their best, maintenance programs must be well-organized and include both preventative and predictive measures. Systematic methods cut down on unexpected downtime and extend the life of membranes.
Routine Inspection and Membrane Cleaning Schedules
Performance baselines during commissioning help monitor ongoing performance. Set normal permeate flow, salt passage, and pressure drop conditions and monitor changes of more than 10-15% from baseline. Monthly performance calculations suggest a progressive deterioration that must be corrected. Performance changes are linked to feed water quality or business operations in detailed operating logs.
Feed water and pretreatment determine membrane cleaning frequency. Systems with strong pretreatment can last 6–12 months, but those in difficult waters must be cleaned every three months. Setting cleaning prompts based on normalized performance decline prevents fouling. Washing is usually needed when pressure drop exceeds 15% or permeate flow drops below 10%. Cleaning up early in the fouling process improves performance more than after significant fouling.
Feed Water Quality Monitoring and Troubleshooting Strategies
Constantly monitoring feed water quality metrics enables you to spot upstream membrane performance issues early. SDI testing at feed water variability frequencies finds pretreatment breakthrough. In steady conditions, measurements are made daily. They are taken hourly during weather or source water changes. Membranes are protected from irreparable particle fouling by keeping the SDI below 5.0, preferably 3.0.
Chemical analyses of conductivity, pH, hardness, alkalinity, silica, and organics show scaling and fouling potential changes. Many sites utilize online conductivity and pH tracking with data logging to detect minor changes that grab samples cannot. Metals, biological oxygen demand, and total organic carbon are analyzed every three months to show seasonal changes. This information aids antiscalant selection, cleaning protocol improvement, and pretreatment changes.
Warranty Coverage and After-Sales Support Considerations
Comprehensive warranties protect facilities from premature membrane failure due to manufacturing or material defects. Based on use and manufacturer compliance, membrane warranties normally cover three years of replacements. Five-year or longer guarantees may cost extra. Purchase contracts should state what the guarantee covers, what it does not cover, and how to register a claim.
For a large RO system, Technical support greatly affects operations. Critical failures are less disruptive when manufacturers offer 24/7 emergency help. Regional service centers repair membrane parts and fix issues quickly. Online technical alerts, application notes, and video training help operators address frequent issues. If suppliers work several shifts or have continuing production plans, facilities should consider how to accommodate them while buying.
Conclusion
Recovery rate optimization in large RO systems cuts down on water use, waste disposal costs, and energy use, all of which have measurable financial benefits. Systematic approaches that look at how well pretreatment works, choosing the right membrane, calibrating operating parameters, and keeping up with maintenance lead to long-lasting performance gains. Facilities should set baseline performance metrics, put in place systems for continuous monitoring, and create structured maintenance programs that will help them be reliable for a long time. Partnering with experienced suppliers who offer full technical support and tried-and-true equipment speeds up optimization success and lowers the risks of implementation. Recovery rate optimization is becoming more of a competitive necessity rather than an optional enhancement as water shortages get worse and government rules get stricter.
FAQ
Q1: What is the typical membrane replacement timeline for large RO systems?
The service life of a membrane depends a lot on the quality of the feed water, how well the preparation works, and the working conditions. Municipal water systems that are well taken care of and have strong pretreatment usually last between 5 and 7 years before they need to be replaced in a large RO system because they are no longer working as well. For tough jobs with salty water or industrial process lines, you might need to change them every 3 to 5 years. Facilities should keep track of normalized performance once a year and plan to replace equipment when cleaning isn't enough to get it back to normal or when salt rejection drops below quality standards.
Q2: Can recovery rates be improved without increasing energy consumption?
Recovery improvement often goes hand-in-hand with energy efficiency improvement through strategies that work together. When you switch to low-energy membrane elements, you need less operating pressure to keep the rejection performance the same. By adding energy recovery devices, hydraulic energy from concentrate streams can be captured, which lowers the net usage. By improving the preparation, membrane fouling can be avoided, and the design flux can be kept at lower pressures. Higher recovery naturally raises osmotic back-pressure, which needs more energy. However, these efficiency measures often cancel out the small increase, leaving overall consumption at the same level or lower.
Q3: What distinguishes large RO systems from small-scale units regarding recovery optimization?
Industrial-scale systems use complex control architecture, staged membrane configurations, and energy recovery equipment that is too expensive for smaller installations. Large installations save money on pretreatment costs because of economies of scale. This lets ultrafiltration or advanced softening work, which supports aggressive recovery operations. Continuous operation and dedicated technical staff make optimization strategies useless for home or small business systems that only work sometimes. Because of these things, large installations can recover 75–85% of their costs, while residential equipment can only recover 50–60%.
Partner with Morui for Advanced Large RO System Solutions
Guangdong Morui Environmental Technology can improve the efficiency of your water treatment with engineered reverse osmosis solutions that are perfect for your needs. Our fully integrated services include making equipment, membranes, and systems, and installing everything. We have over 500 dedicated employees, including 20 specialized engineers spread out across 14 branch locations. We make custom large RO systems that can handle 10,000 to 500,000 gallons of wastewater every day. These systems include high-flux TFC membranes, energy recovery devices, and modern PLC control platforms that make recovery rates as high as possible while still meeting strict quality standards. We put together reliable solutions with full expert support and maintenance plans because we are an authorized supplier of high-quality parts from Shimge, Runxin, and Createc. Morui's proven experience serves the manufacturing, power generation, electronics, and local sectors around the world, whether you need pharmaceutical-grade purified water systems, industrial process water equipment, or desalination plants for cities. For detailed system assessments, customized proposals, and competitive large RO system manufacturer pricing that helps you reach your operational excellence goals, please email our engineering team at benson@guangdongmorui.com.
References
1. American Water Works Association (AWWA). "Reverse Osmosis and Nanofiltration: Manual of Water Supply Practices M46," Second Edition, 2007.
2. Wilf, M. and Bartels, C. "Optimization of Seawater RO Systems Design," Desalination Journal, Vol. 173, Issue 1, 2005.
3. Greenlee, L.F., Lawler, D.F., Freeman, B.D., Marrot, B., and Moulin, P. "Reverse Osmosis Desalination: Water Sources, Technology, and Today's Challenges," Water Research, Vol. 43, Issue 9, 2009.
4. Fritzmann, C., Löwenberg, J., Wintgens, T., and Melin, T. "State-of-the-Art of Reverse Osmosis Desalination," Desalination, Vol. 216, Issues 1-3, 2007.
5. Baker, R.W. "Membrane Technology and Applications," Third Edition, John Wiley & Sons, 2012.
6. Membrane Filtration Guidance Manual, United States Environmental Protection Agency, Office of Water, EPA 815-R-06-009, 2005.
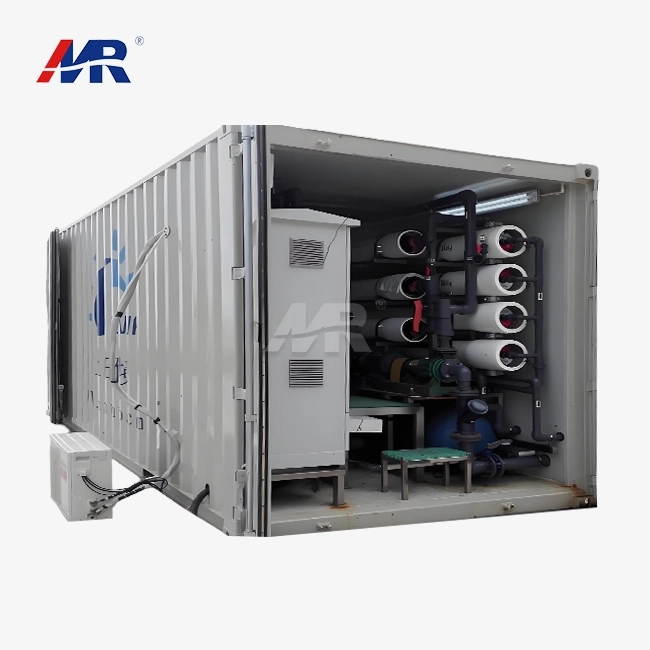 VIEW MOREcontainerized ro systems
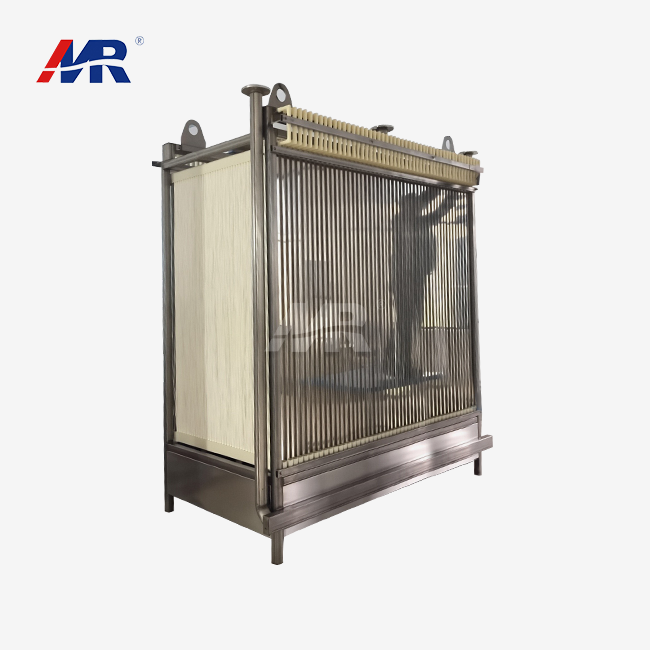 VIEW MOREsubmerged membrane bioreactor
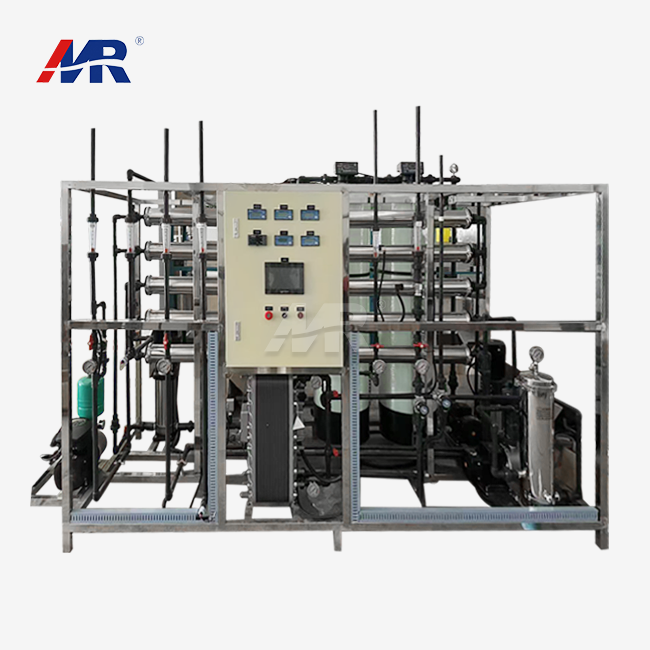 VIEW MOREedi purified water system
 VIEW MORE8040 reverse osmosis membrane
 VIEW MORE8m3/hour two pass reverse osmosis system
 VIEW MOREedi system in water treatment
 VIEW MORE2 stage reverse osmosis system
 VIEW MOREMBR wastewater treatment plant