
_1745823981883.webp)

What Recovery Rate Can a Containerized Reverse Osmosis System Hit?
Recovery rate is an important success measure for judging the value of investments in water treatment. Recovery rates for a containerized reverse osmosis system are usually between 50% and 85%, based on the salinity of the feed water and the quality of the preparation. Most brackish water uses get between 75 and 85% of their water back, while saltwater desalination units work at 40 to 50 percent to protect the membrane and use as little energy as possible. These modular systems use advanced membrane technology inside ISO-standard containers to provide adaptable, all-in-one solutions that combine water efficiency with long-term operating viability in a wide range of fields, from pharmaceuticals to public water services.
Understanding Recovery Rate in Containerized Reverse Osmosis Systems
What Does Recovery Rate Actually Mean?
Recovery rate is the amount of feed water that was successfully turned into clean permeate. To get 75% of the feedwater back, we process 100,000 liters of it and get 75,000 liters of clean permeate. Since better recovery means less water waste and lower feed water volume needs, this measure has a direct effect on operational costs. Over the system's lifetime, this means big savings.
Why Does Recovery Rate Matter for Your Bottom Line?
Industrial activities make money by using water efficiently. Pharmaceutical companies that make GMP-standard pure water need to get the most work done while keeping wastewater release fees as low as possible. In the same way, power plants that need ultrapure water for boiler feed systems have limited funds to buy water. A 10% increase in the recovery rate can cut water costs by thousands of dollars a year and show regulators and consumers that you care about the climate.
Typical Recovery Benchmarks for Modular RO Units
The performance of containerized reverse osmosis systems is about the same as that of standard fixed setups. Brackish water reverse osmosis (BWRO) units always get 75–85% of the water back when they treat well water or surface water with TDS levels below 5,000 ppm. Seawater reverse osmosis (SWRO) systems that aim for salinities between 35,000 and 45,000 ppm work at 40 to 50 percent recovery to avoid too much osmotic pressure and membrane growth. With strong pretreatment integration, industrial wastewater treatment systems that deal with feed quality that varies usually keep recovery rates between 60 and 70%.
How Does Containerization Impact Recovery Performance?
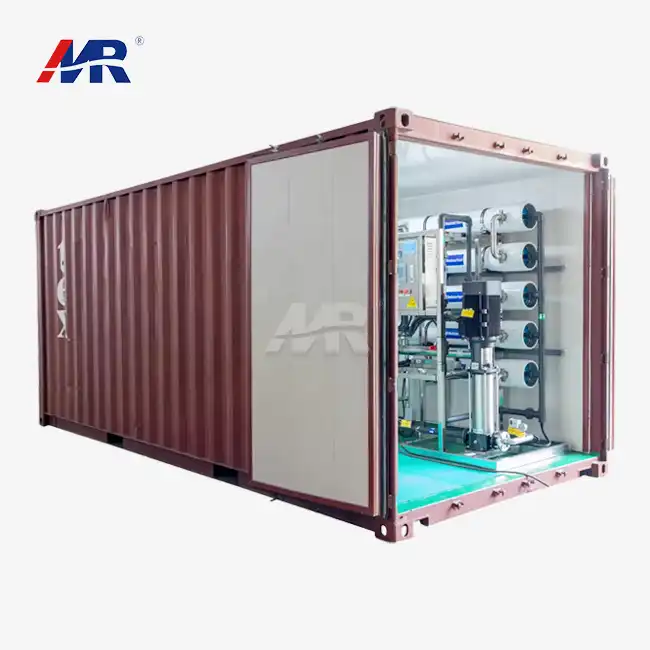
There are clear benefits to the small design of ISO shipping containers. Climate-controlled shelters keep the membrane's working temperature between 20°C and 25°C, no matter what the weather is like outside. This stops changes in viscosity that slow down permeate flux. Integrated HVAC systems with 50 mm of thermal insulation protect against both Arctic cold and desert heat, making sure that recovery rates are the same everywhere they are used. Because the environment is stable, activities can happen in places like crisis aid zones, offshore platforms, and remote mine sites where traditional plants can't work regularly.
Key Factors Influencing Recovery Rate in Containerized RO Systems
Feed Water Quality and Pretreatment Requirements
Recovery rates are largely determined by the properties of the feed water. The osmotic pressure goes up when the salinity is high, which means that more energy is needed, and the possibility for healing is limited. Organic matter, bacterial contaminants, and suspended solids all speed up membrane fouling, which over time lowers flow and recovery.
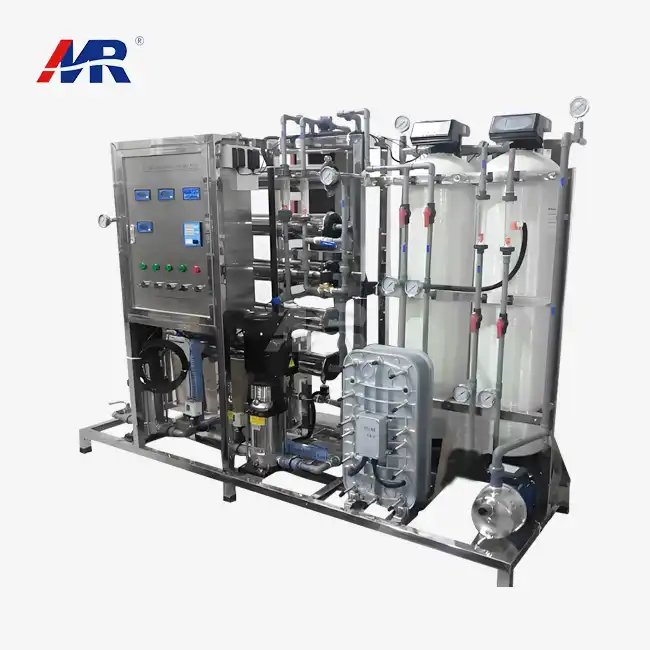
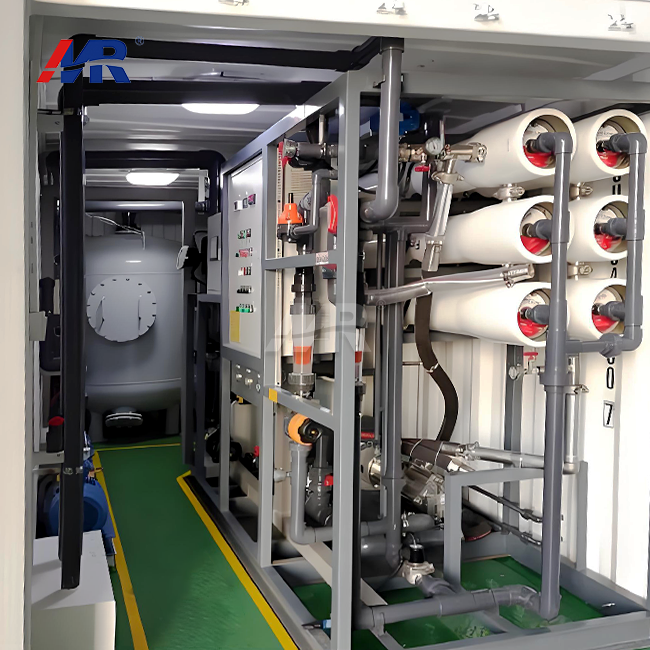
It becomes necessary to have effective therapy. We use multimedia filters to get rid of particles and keep the Silt Density Index (SDI) below 3 to protect the membrane surfaces. Ultrafiltration (UF) systems are the best way to keep public water sources clear. Chemical treatment skids inject antiscalants to stop the formation of calcium carbonate and barium sulfate crystals. This lets more water be recovered without the risk of scaling. These pretreatment components are housed in advanced containerized reverse osmosis systems along with ro membranes. This makes complete treatment trains that are best for the feedwater profiles.
Membrane Selection and System Configuration
The choice of membrane technology has a direct effect on the ability to heal. High-flux spiral-wound membranes made of a polyamide thin-film blend provide better salt rejection (more than 99.5%) while keeping permeate flow rates the same. It is important for off-grid uses that use diesel engines or solar panels because low-energy membranes lower the operating pressure needed. This lets better recovery rates happen with less power being used.
Configuring the system is just as important. Multi-stage systems with interstage booster pumps keep the driving pressure high enough across the membrane array, which leads to a higher recovery rate. Two-pass designs meet the requirements for ultrapure water that semiconductor manufacturing needs while keeping the total system recovery rate high. Containerized units with variable frequency drive (VFD) pumps change flow rates and pressures automatically based on the conditions of the feed water in real time, always making recovery better.
Energy Recovery Devices and Power Efficiency
Energy Recovery Devices (ERDs) are a revolutionary way to make systems more cost-effective. In ocean uses, these mechanical devices take hydraulic energy from high-pressure concentrate streams and add it to incoming feed water. This cuts the amount of power needed by pumps by 40 to 60 percent. When pressure exchangers, Pelton turbines, and turbochargers are built into containerized systems, the specific energy needed to desalinate saltwater drops below 3.0 kWh/m³. This means that bold recovery goals can be met without breaking the bank.
It takes a lot of work to find a balance between healing goals and energy costs. When you push healing rates past their best points, the pressure needs and membrane stress go up exponentially, which means that the benefits become less. We look at the energy costs, water scarcity premiums, and discharge fees that are specific to each site to find the recovery rate that meets output volume goals while lowering the total cost of ownership.
Comparing Containerized Reverse Osmosis Systems to Traditional RO Plants
Performance Parity with Fixed Installations
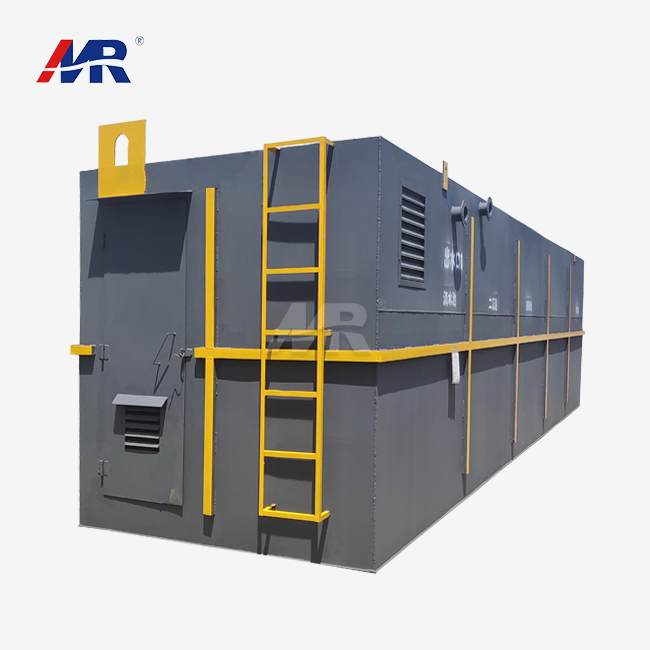
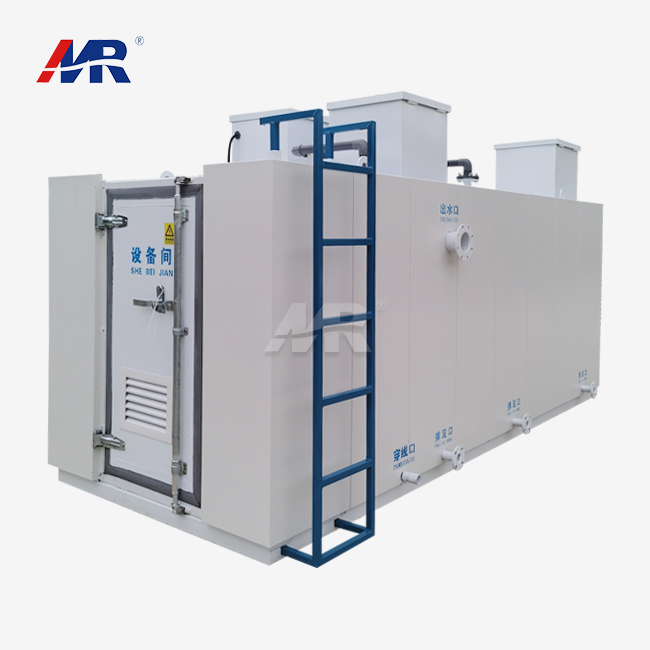
Through similar membrane technology and hydraulic design, containerized reverse osmosis systems can achieve recovery rates that are the same as stick-built plants. A 40-foot container with saltwater desalination equipment gets the same 45% recovery as fixed sites that use the same feed water. The main difference is how quickly they can be set up. Containerized units arrive at sites already fully operational and only need to be connected to utilities. This cuts down on the 6–12 month building times and high civil engineering costs of standard plants of the same capacity.
Operational Flexibility and Scalability Advantages
The modular design lets the capacity grow by adding more parallel containerized units. If a company that processes drinks has seasonal demand changes, it can use extra containers when production is high and move them to other facilities when production is low. This adaptability keeps fixed infrastructure investments from going overboard while keeping recovery rates at their best for a wide range of production levels. Moving whole water treatment systems as operations progress without giving up on capital investments is a huge benefit for mining operations that are only working in temporary extraction sites.
CAPEX and OPEX Considerations
Because containers are more expensive to make and their parts are harder to fit together, capital costs for containerized systems are usually 20–30% higher per cubic meter of capacity than for big fixed plants. However, the overall cost of a project is often less when site preparation is skipped, building time is cut, and delays in getting permits are avoided. When recovery rates are the same, operational costs stay the same because the cost of replacing membranes, using chemicals, and energy is based on the chemistry of the water rather than the design of the plant.
A better comeback directly raises the return on investment. A pharmacy plant that makes 100 m³/day of clean water at 80% recovery instead of 70% recovery saves over 5,000 m³ per year, or about 14 m³/day of feed water. At industrial water rates of $2 to $5 per cubic meter, this improvement to recovery saves $10,000 to $25,000 a year while lowering the amount of trash and the cost of release by the same amount.
Application-Specific System Selection Guidance
Coastal cities can use containerized SWRO systems for seawater desalination projects as long as they don't need more than 5,000 m³/day of capacity. Above that, standard plants are better because of economies of scale. Containerized mobility is used in electroplating and chemical processing to treat effluent streams at various plant locations as part of industrial wastewater recycling. Agricultural irrigation projects that clean salty groundwater in dry areas use containerized BWRO units to get 80% recovery. This protects valuable water resources and lets crops grow in places that weren't good for growing crops before.
Optimizing and Maintaining High Recovery Rates in Containerized RO Systems
Installation and Commissioning Best Practices
When rollout is done right, healing rates that were planned become real. When the site is prepared, it must have level supports that can hold up to 30,000 kg of fully filled containers and enough drainage for the concentrate to flow out. The quality of the power source is very important—voltage changes of more than ±5% hurt VFD controls and make pumps less efficient. During launch, water chemistry analysis checks to see if the pretreatment worked properly before adding feed water to the membranes. This stops fouling right away, which forever lowers the ability to recover.
Routine Maintenance Strategies
Cleaning methods for membranes keep healing rates high over the life of the system. Clean-In-Place (CIP) systems built into containers use alkaline detergents to get rid of organic fouling and acidic solutions to break mineral scales. These systems run chemical cleaning processes automatically. When the normalized permeate flow and salt passage are monitored, cleaning actions are taken before the rebound drop goes over 10%. Prefilters, dosing pumps, and pressure tanks are checked every three months to find worn-out parts that need to be replaced. This keeps breakdowns from starting and making it harder for the system to recover.
Lifecycle Management and Performance Monitoring
Under normal conditions, membrane elements work at their best for three to five years before they need to be replaced because the flux starts to drop. Engineering teams can get real-time information on flow rates, pressure differences, and conductivity from remote tracking systems with IoT-enabled SCADA platforms. These systems join via satellite or 5G. Patterns of performance degradation can be found using predictive analytics. This lets you plan proactive membrane replacements that avoid unexpected recovery losses and production interruptions.
The structural stability rating for the container for 15 to 20 years is longer than the membrane's lifespan. This means that the same mobile platform can use more than one generation of membranes. Because they last so long, containerized reverse osmosis systems become long-term investments instead of short-term fixes. As membrane technology improves, recovery rates go up, adding to the value over decades of use.
Practical Insights and Business Considerations for Procurement
Essential Procurement Criteria
Technical leaders should put recovery rate guarantees within specs at the top of their list of priorities. They should also demand performance guarantees with penalty terms in case systems fail to meet contracted recovery goals under specified feedwater conditions. The type of membrane you choose is important. Well-known companies like DuPont, Toray, and Hydranautics offer uniform quality and easy access to replacement parts around the world. The amount of automation decides how much labor is needed. PLC-based controls from Siemens or Allen-Bradley have been shown to be reliable, and technicians who are already familiar with them can save money on training.
Evaluating Suppliers and Building Trust
Reputable makers show their knowledge by putting together case study portfolios with examples of successful operations in similar settings. ISO 9001 approval proves that quality management is being used in manufacturing, and ASME pressure tank code compliance makes sure that safety is being met. Full support after the sale, with technical hotlines open 24 hours a day, 7 days a week, an inventory of spare parts, and the ability to do field service, boosts trust for remote sites where downtime directly affects production income. The buyer's risk is transferred to the seller by warranties that cover the performance of the membrane for two to three years and the structural stability of the container for five years or more.
Cost-Benefit Analysis Framework
To figure out the total cost of ownership, you have to take into account how the recovery rate changes over the life of the machine. Higher recovery lowers the yearly costs of getting feed water and getting rid of garbage. By comparing the exact kWh used per cubic meter of permeate created, an energy usage study shows that running costs vary between providers. Instead of buying new equipment, middle and small businesses can lease it, sign performance-based contracts, or set up build-operate-transfer agreements as ways to finance it. This helps their cash flow and gives them access to modern containerized reverse osmosis systems.
We work with petrochemical plants that treat oilfield-produced water for useful reuse, local utilities that want to increase treatment capacity without buying more land, and pharmaceutical companies that need water systems that are FDA-compliant. Customized recovery optimization is needed for each application to meet water-saving goals, energy budgets, and discharge rules.
Conclusion
Recovery rates in containerized reverse osmosis systems reach 75–85% for brackish water and 40–50% for seawater uses. These rates are the same as standard plants but can be used on flexible, quickly deployable platforms. Recovery goals are set by the quality of the feed water, the choice of filter, the use of preparation, and the addition of an energy recovery device. These modular systems are very valuable because they cut down on building times, give businesses more operating flexibility, and can be scaled up or down to meet different industry needs. Careful review of suppliers, thorough cost-benefit analyses, and proactive maintenance plans guarantee long-lasting recovery performance throughout operational lifetimes. This turns water treatment from an infrastructure burden to a competitive advantage.
FAQ
1. What recovery rate should we expect for seawater desalination?
When handling ocean water with 35,000 to 45,000 ppm TDS, containerized reverse osmosis systems usually get 40 to 50 percent recovery. Higher recovery rates make the concentrate more salty and raise the osmotic pressure by a factor of ten. This needs a lot of energy and puts the membrane at risk of scaling. At these salinity levels, energy recovery devices are needed to keep the cost of running within normal recovery values.
2. How does feed water variability affect operational stability?
Changes in the quality of the feed water have an effect on recovery by altering the rates of fouling and scaling. Modern containerized systems have real-time tracking and chemical dosing changes that are made automatically to keep the pretreatment working well. Changes in conductivity cause variable frequency drives to change the pressure and flow rates. This keeps the quality of the permeate stable and helps it rebound, even when the feed changes, which can happen in public water sources and industrial wastewater streams.
3. What energy costs are involved in achieving higher recovery efficiency?
Because higher osmotic pressure needs higher hydraulic pressure, energy use goes up in a way that isn't a straight line with recovery. Systems that deal with brackish water that need 0.5 to 1.5 kWh/m³ to reach 75% recovery may need 2.0 to 3.0 kWh/m³ to reach 85% recovery. With energy recovery devices, seawater uses between 3.5 and 5 kWh/m³ at a return rate of 50%. Electricity rates at each site decide the best recovery point from an economic point of view, taking into account both energy costs and water savings.
Partner with Morui for Optimized Water Treatment Solutions
Guangdong Morui Environmental Technology offers special containerized reverse osmosis system options that are designed to get the best recovery rates for your needs. Our 20+ experienced engineers look at the chemistry of your feed water, your output needs, and the factors at the site to figure out the best membrane configurations and pretreatment systems for you. We keep an eye on quality throughout the whole manufacturing and integration process because we have our own plant for making membranes, multiple sites for processing equipment, and partnerships with top brands like Shimge Water Pumps and Runxin Valves. We offer full turnkey services that include supplying the equipment, installing it on-site, and providing help during setup. All of these services are backed by full guarantees. As a well-known company that makes containerized reverse osmosis systems for 14 regional offices that serve pharmaceutical, municipal, petrochemical, and industrial clients, we know what expert decision-makers and financial officers look for in a supplier. Get in touch with our engineering team at benson@guangdongmorui.com to talk about how our containerized RO systems can help you get more water back while cutting down on costs.
References
1. Greenlee, L.F., Lawler, D.F., Freeman, B.D., Marrot, B., & Moulin, P. (2009). Reverse osmosis desalination: Water sources, technology, and today's challenges. Water Research, 43(9), 2317-2348.
2. Voutchkov, N. (2018). Energy use for membrane seawater desalination – current status and trends. Desalination, 431, 2-14.
3. Wilf, M., & Bartels, C. (2005). Optimization of seawater RO systems design. Desalination, 173(1), 1-12.
4. Fritzmann, C., Löwenberg, J., Wintgens, T., & Melin, T. (2007). State-of-the-art of reverse osmosis desalination. Desalination, 216(1-3), 1-76.
5. Ruiz-García, A., & Nuez, I. (2020). Performance assessment of SWRO spiral-wound membrane modules with different feed spacer dimensions. Processes, 8(6), 692.
6. Qasim, M., Badrelzaman, M., Darwish, N.N., Darwish, N.A., & Hilal, N. (2019). Reverse osmosis desalination: A state-of-the-art review. Desalination, 459, 59-104.