
_1745823981883.webp)

How to Optimize Performance of a Large Reverse Osmosis System?
Before you can optimize a large reverse osmosis system, you need to know what its baseline performance measures are and take steps to fix the problems that slow it down in terms of throughput, water quality, and energy economy. These large reverse osmosis systems provide uniform permeate for a wide range of uses, from making medicines to desalinating water for cities. Targeted optimization directly leads to lower running costs, longer membrane lifespan, and regulatory compliance that saves your bottom line, whether you are in charge of a 50,000-gallon-per-day facility or a multi-stage seawater treatment complex. Large reverse osmosis systems have to deal with operating stresses that smaller units don't have to. Changes in feed water from municipal and brackish sources can damage membranes, and chemical-filled wastewater from electroplating or petrochemical plants needs strong pre-treatment procedures. Purchasing managers and building engineers know that a well-optimized system cuts down on unplanned downtime, which is very important when production lines depend on a steady supply of ultrapure water. This book gives useful, data-driven advice for people who have to make decisions about upgrades, service contracts, or picking dependable equipment sellers. To optimize something well, you need to find the right balance of many factors in the pre-treatment steps, membrane arrays, and post-treatment conditioning. Our method focuses on making changes that building teams can make with little or no additional cost, while also finding situations where technology upgrades or relationships with vendors provide a clear return on investment. In this guide, we use examples from the food processing, pharmaceutical production, and power generation industries to show how regular performance changes can help a business reach its goals.

Assessing Current Performance and Identifying Bottlenecks
Establishing Baseline Performance Metrics
To do a good review, you must first measure the key performance factors that show how healthy the system is. In well-run commercial facilities, the recovery rate, which is the amount of feed water that is turned into permeate, is usually between 50 and 80 percent. By comparing the standardized permeate flow to the design specs, you can see patterns of membrane fouling before they get worse and cause expensive failures. Conductivity tests show that salt rejection works well. In industrial settings, membranes usually remove 99.2% to 99.8% of dissolved solids when they work within the pressure ranges stated by the maker.
A key economic measure is the amount of energy used per gallon of filtrate made. Modern installations with energy recovery devices often use 40% less electricity than older installations with high-pressure pumps that don't have variable frequency drives. By keeping track of both system uptime and repair logs, you can tell if speed drops are caused by bad operational practices or by limitations in the design itself. We suggest setting up a review schedule that checks real performance against OEM specs and industry standards every three months.
Common Performance Challenges in Industrial RO Systems
Most of the time, membrane fouling is what slows down large-scale processes. Even after pre-filtration, colloidal particles, cellular growth, and organic matter build up on membrane surfaces. This makes the trans-membrane pressure needed rise and the flow decrease. Scaling happens when calcium carbonate, silica, or barium sulfate settles on the membrane's surface as concentrate streams get close to the saturation point. Biofilm formation is a problem in pharmaceutical and food-grade uses that normal CIP cycles can't fully fix.
When pressure drops across membrane stages in a large reverse osmosis system, it means that flow is being limited. This makes pumps work harder, which increases energy costs while providing smaller amounts of permeate. Chemical imbalances in anti-scalant dosing or pH changes lead to other issues. For example, too much dosing wastes chemicals and makes it harder to get rid of wastewater, while too little dosing speeds up scaling. Changes in temperature affect the permeability of membranes and the rate at which salt passes through them. However, many facilities don't have automatic compensation controls that change working settings when seasonal water temperatures change...
Diagnostic Tools and Performance Monitoring
Differential pressure, conductivity, and flow rates can be tracked in real time across each membrane step by modern SCADA systems that are built with programmable logic controllers. Putting SDI meters on feed lines lets you know about the possibility of colloidal fouling early on, before the particles reach expensive membrane elements. With handheld conductivity probes and portable TOC testers, maintenance teams can check the quality of the permeate at sampling ports all over the distribution network. This way, they can catch changes in quality before they affect processes further down the line.
Software analytics systems now use machine learning algorithms on past performance data to guess when maintenance will be needed and suggest actions that can be taken before they happen. These tools look at patterns in pump vibrations, chemical use, and pressure changes to figure out when the membranes need to be cleaned more accurately than set calendar dates. Facilities that use condition-based maintenance methods have 25–35% less unexpected downtime than those that use reactive maintenance methods. A full diagnostic system is made up of automatic tracking and monthly manual checks of O-rings, pressure gauges, and valve actuators.
Principles and Best Practices for Optimizing RO System Performance
Pre-Treatment Optimization Strategies
The quality of the feed water has a big effect on how long the membranes last and how well the system works. Multi-media filtration gets rid of the dissolved solids that would otherwise damage ro membranes within a few weeks of being put into use. Hardness ions that form scale can be removed by softening equipment, and chlorine that quickly breaks down thin-film composite membranes can be removed by activated carbon adsorption. Anti-scalant injection systems that are tuned to the site-specific water chemistry help industrial sites that handle brackish groundwater keep calcium sulfate and silica from precipitating, even at high recovery rates.
Microfiltration or ultrafiltration pre-treatment is better at reducing turbidity than regular media filters, especially for public water sources that get algae blooms every so often. These membrane-based pre-treatment steps consistently get SDI values below 3.0, which is the level needed for RO to work reliably. Pharmaceutical companies and electronics makers are using UF pre-treatment more and more to meet strict quality standards while using fewer chemicals. When pre-treatment trains are built correctly, they can increase the service life of a RO membrane from 3 to 5 years to 7 to 10 years in tough situations.
Operational Parameter Adjustment
Feed pressure adjustment combines the production of permeate with the use of energy and the stress on the membrane. When you operate close to the upper pressure limit that the membrane maker sets, the flow rate is maximized, but physical compaction speeds up, which forever lowers the membrane's permeability. On the other hand, not enough pressure means that output potential is not being used. High-pressure pumps with variable frequency drives can precisely control the pressure in response to changes in the temperature of the feed water. For example, a 1°C temperature change can change the permeability of a membrane by about 3%, so the pressure needs to be changed to keep the permeate flow stable.
Changing the recovery ratio has a direct effect on the salinity and growth ability of the concentrate stream. Even with anti-scalant treatment, calcium carbonate will form if recovery rates are pushed above 75% in high-hardness situations. Staged array designs with interstage boosting make it possible for higher total recovery while keeping the concentrate salinity in each tank at a level that can be handled. Optimizing the flow rate through each membrane element stops bending, which is an uneven flow distribution that makes lead elements get clogged up too soon while downstream membranes aren't being used enough.
Maintenance Protocol Implementation
Cleaning schedules get rid of foulants before they stick to membrane surfaces permanently in large reverse osmosis systems. Cleaning with low-pH citric acid breaks down metal scale, while cleaning with high-pH detergents breaks up organic matter and biofilms. Every three to six months, switching between acidic and basic cleaning processes keeps membrane flow close to what it was designed to be. Facilities that deal with difficult feed waters may need to be cleaned once a month, or more often if the standardized pressure drop rises by 10 to 15 percent above baseline.
Instead of making big changes to the whole array, replacing membrane elements is done in a planned way. Using isolation testing to keep an eye on the performance of each individual part lets you change only the ones that aren't working, which saves money and keeps the system running. Systematic record-keeping keeps track of when each part was installed, how often it was cleaned, and how well it works over time. This lets you make decisions about replacements based on data. By replacing the O-ring and seals when the membrane is changed, bypass flow that lowers the quality of the permeate is stopped. By catching pre-treatment breakthrough, replacing the cartridge filter every 30 to 90 days saves membrane investments.
Implementing Effective Techniques and Technologies
Advanced Membrane Technologies
These new high-rejection membranes can now reject 99.8% of salt while keeping flow rates 20% higher than the elements of the previous generation. These membranes use special polyamide chemicals that can handle more chlorine, which makes them last longer in situations where small oxidants get through pre-treatment. Boron-selective membranes are used to meet specific needs in the pharmaceutical and electronics industries, where regular elements don't meet the sub-ppm boron requirements. Low-energy membranes lower the working pressure needed by 15–20% while keeping the quality of the permeate the same while using significantly less pump energy.
Fouling-resistant membrane coats change the surface charge qualities to keep biofilm from sticking and organic foulants from sticking. These hydrophilic surface treatments are especially useful for treating wastewater in places where regular membranes need to be cleaned harshly every week. Facilities that replace older membrane parts in pressure vessels say the payback time is 18 to 24 months because they save money on chemicals and don't have to clean as often. Membrane providers now offer performance promises based on specific factors of the quality of the feed water. This transfers operational risk and gives procurement teams clear performance standards.
Automation and Control System Integration
Programmable logic devices that are connected to sensor networks make it possible to use complex control methods that would not be possible if they were done by hand. When the system shuts down, automated flush processes keep the concentrate from becoming saturated. This keeps salt from building up in the membrane elements during idle times. When the quality of the arriving water goes above the design limits, feed conductivity monitoring sets off automatic shutdown processes. This keeps membranes from getting damaged permanently. Before water that doesn't meet standards gets to the process tanks, permeate conductivity alarms let workers know if the membranes fail or if the O-rings get bypassed.
Maintenance teams can use networked computers or mobile devices to get to real-time performance screens that are shown by human-machine interfaces. Trend analysis tools show pressure, flow, and quality data over time periods chosen by the user, showing small patterns of performance decline. With remote monitoring, equipment sellers or third-party service providers can find problems and suggest fixes without having to visit the site. This speeds up response times during working disruptions. Automated chemical dosing systems keep the anti-scalant and pH levels just right by continuously analyzing the feed water. This gets rid of the need for human jar testing and user error.
Energy Recovery Implementation
Energy recovery devices take hydraulic energy from high-pressure concentrate streams and add it to incoming feed water. This lowers the amount of power needed for the pump by 40 to 60% in seawater uses. Isobaric chambers in pressure exchanges directly move 95–98% of the pressure between the concentrate and feed streams. In systems that process 25,000 gallons or more of water per day or more, these devices are a good value. They pay for themselves in less than three years in energy-intensive desalination situations. Before adding energy recovery to an established system, it needs to be carefully analyzed hydraulically to make sure that the flow rates and pressure profiles are suitable.
Compared to regular induction motors, high-efficiency pumps with permanent magnet motors and improved rotor designs use less energy. By matching pump output directly to system demand, variable frequency drives get rid of the losses caused by throttling valves. Pump staging techniques spread the hydraulic work among several smaller pumps that are working at their most efficient levels instead of using one large pump that is only partially loaded. When sites with on-site energy use combined heat and power, they can use waste heat to pre-heat feed water, which improves membrane flux while using less electricity from the grid.
Case Studies Demonstrating Successful Performance Optimization
Pharmaceutical Manufacturing Facility Enhancement
A pharmaceutical contract maker that ran a 75,000-gallon-per-day system to make USP-grade purified water had to deal with rising upkeep costs and frequent quality problems. Seasonal turbidity spikes in feed water from a city source overwhelmed current multimedia filters, resulting in SDI readings above 5.0 during spring runoff. Ultrafiltration pre-treatment was put in place, and fouling-resistant membranes were upgraded. At the same time, a predictive maintenance program based on constant pressure tracking was put in place.
Over the course of 18 months, measurements showed that the permeate conductivity stayed stable within a 2% range, compared to 15% swings in the previous setup. The number of times the membrane was cleaned dropped from once a month to three times a year, which saved $18,000 a year on chemicals. System uptime went from 94% to 98.5%, which got rid of output delays caused by problems with the water system. Within 28 months, the pharmaceutical company got back the $120,000 it spent on upgrades by cutting down on maintenance work, saving money on chemicals, and getting rid of batch failures.
Municipal Water Treatment Expansion
A coastal city with a brackish water treatment plant that serves 45,000 people needed to add more capacity for a large reverse osmosis system to keep up with population growth. Instead of building a second treatment train, engineering experts said that the current 200,000-gallon-per-day system should be made better by increasing its recovery rate and adding energy recovery features. A study of the feed water showed that low recovery rates and careful anti-scalant doses meant that production capacity wasn't being used.
The city built a two-stage pressure exchanger system and improved to high-rejection membranes that can collect 75% of the water in brackish situations. Based on real-time concentrate chemistry tracking, automated chemical dosing methods improved the use of anti-scalant. Using the equipment that was already there, production went up to 285,000 gallons per day, saving $2.8 million in new building costs. The amount of energy used per gallon went down by 38%, which saved $94,000 a year. The project showed that regular streamlining can lead to growth without having to spend a lot of money on new equipment.
Food and Beverage Processing Optimization
A beverage bottling plant that processes 150,000 gallons of water every day had membrane fouling caused by seasonal farming flow that affected their well water source. The organic-rich foulant matrix was not cleaned effectively with standard methods and common formulas. The facility worked with a membrane source to use cleaning chemicals that were specially made for the foulant makeup that was found through autopsy analysis of the membrane.
Targeted cleaning Products brought back membrane flow to 95% of its original design values, while normal cleaners could only get it back to 70%. The cleaning cycle went from taking eight hours to four hours, which cut down on production downtime by half. During high-risk times, the plant added side-stream microfiltration to their feed line. This kept SDI values stable even though the quality of the source water changed. Over the course of two years, the cost of replacing membranes went down by 60% because they lasted longer and didn't need as much special cleaning chemistry.
Summary of Key Points and Long-Term Performance Management
For long-term performance improvement, you need to keep an eye on business basics and adopt new technologies strategically. Standardized KPIs are used in regular performance reviews to set objective baselines that help with decision-making about interventions. The most important thing that decides how long a membrane lasts is how well it was treated before it is used. Investing in strong feed water conditioning stops costly failures later on. Adjusting operational parameters based on the real conditions of the feed water improves production efficiency within the limits set by the membrane maker.
Instead of fixing problems after they happen, predictive maintenance programs use technology and data analytics to stop them before they happen. New technologies, like improved filters, energy recovery devices, and better control systems, give measurable benefits when used in the right way for the job. Partnering with vendors to get full service agreements protects expensive equipment and makes sure that users can get specialized help when they run into problems. Planning for scalability through flexible designs lets you handle growth without having to update the whole system.
Regulatory compliance and water quality standards are always changing, so systems need to be able to react to new, stricter rules. Facilities that make optimization an ongoing process instead of one-time projects stay ahead of the competition by having lower running costs and higher dependability. Protocols for keeping track of performance trends, maintenance actions, and working conditions build institutional knowledge that stays with the company even when staff changes and helps with strategic planning.
FAQ
1. How often should I perform maintenance on industrial reverse osmosis equipment?
When to do maintenance depends on the quality of the feed water and how busy the business is. Facilities that treat city water with good pre-treatment usually need to clean their membranes every three to six months. Facilities that treat wastewater or difficult salty sources may need to do this every month. Based on tracking of difference pressure, cartridge filters need to be changed every 30 to 90 days. Mechanical breakdowns can be avoided by inspecting pumps, valves, and instruments once a year. Condition-based monitoring that looks at changes in pressure and flow gives more accurate repair schedules than set calendars.
2. What factors determine appropriate system capacity for my application?
Capacity selection strikes a mix between meeting peak demand needs and making the most of the economy. Figure out how much water the process needs, how many times it needs to be cleaned, and safety factors of 15–25%. Recovery rates depend on the TDS levels of the feed water and the quality of the permeate that is needed. Sources with a lot of salt need bigger systems to produce the same amount of output. In some places, the greatest healing is limited by the amount of concentrate that can be released by regulations. Oversizing initial setups is more expensive than using modular designs that can be expanded in the future.
3. How can energy costs be reduced in high-volume desalination operations?
Energy recovery devices that capture the concentrated stream hydraulic pressure cut the power needed by the pump by 40 to 60%. Variable frequency drives make the pump work as efficiently as possible under different loads. Preheating the feed water with waste heat or solar thermal improves membrane flow while lowering the need for electricity. For the same level of percolate, high-efficiency membranes work at lower pressures. In places where energy prices are based on demand, off-peak operation plans move production to times when electricity rates are lower. Monitoring performance on a regular basis stops loss of efficiency that leads to gradual increases in energy use.
Partner with Morui for Industrial Water Treatment Excellence
Guangdong Morui Environmental Technology's combined method to reverse osmosis system optimization for large reverse osmosis systems helps businesses that need to clean water quickly and effectively. Our engineering teams do thorough speed tests that find the specific problems that are stopping your system from working as well as it could. Morui offers complete solutions that include designing the pre-treatment process, choosing the membranes, integrating automation, and ongoing service support. They have more than 14 regional branches and 20 specialized engineers with a lot of experience in pharmaceutical, food processing, and city applications.
As part of our strategic relationships with top component sources like Shimge Water Pumps, Runxin Valves, and Createc Instruments, we can get high-quality equipment at prices that are competitive. Our membrane production plant makes custom elements that work best with difficult feed water chemicals that standard goods don't handle well. If you need a large reverse osmosis system provider for new setups or to improve the performance of existing infrastructure, Morui can help. Before deploying, they offer factory acceptance testing that mimics your real working conditions.
Contact our technical team at benson@guangdongmorui.com to schedule a facility assessment and receive a detailed optimization proposal. Through evidence-based treatments that are adapted to your operating needs, we make recovery rates, energy efficiency, and membrane longevity better in ways that can be measured.
References
1. American Water Works Association (AWWA). "Reverse Osmosis and Nanofiltration: Manual of Water Supply Practices M46." Second Edition, 2007.
2. Wilf, M. and Bartels, C. "Optimization of Seawater RO Systems Design." Desalination Journal, Volume 173, Issue 1, 2005.
3. United States Environmental Protection Agency. "Membrane Filtration Guidance Manual." Office of Water, EPA 815-R-06-009, 2005.
4. Greenlee, L.F., Lawler, D.F., Freeman, B.D., Marrot, B., and Moulin, P. "Reverse Osmosis Desalination: Water Sources, Technology, and Today's Challenges." Water Research, Volume 43, Issue 9, 2009.
5. Fritzmann, C., Löwenberg, J., Wintgens, T., and Melin, T. "State-of-the-Art of Reverse Osmosis Desalination." Desalination Journal, Volume 216, Issues 1-3, 2007.
6. Voutchkov, N. "Considerations for Selection of Seawater Filtration Pretreatment System." Desalination Journal, Volume 261, Issues 3, 2010.
 VIEW MOREcontainerized water treatment systems
 VIEW MORE8040 reverse osmosis membrane
 VIEW MORE100m3/hour reverse osmosis equipment
 VIEW MORE150m3/hour reverse osmosis plant
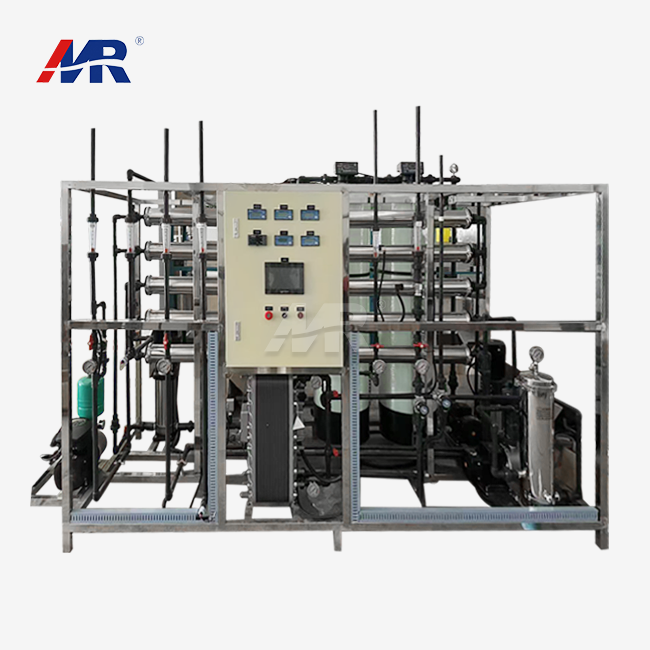 VIEW MOREedi purified water system
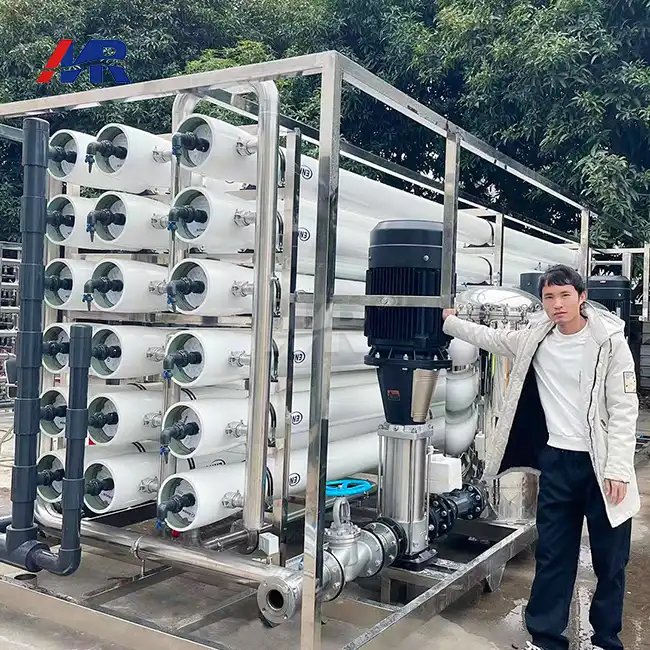 VIEW MORE100m3/hour reverse osmosis system
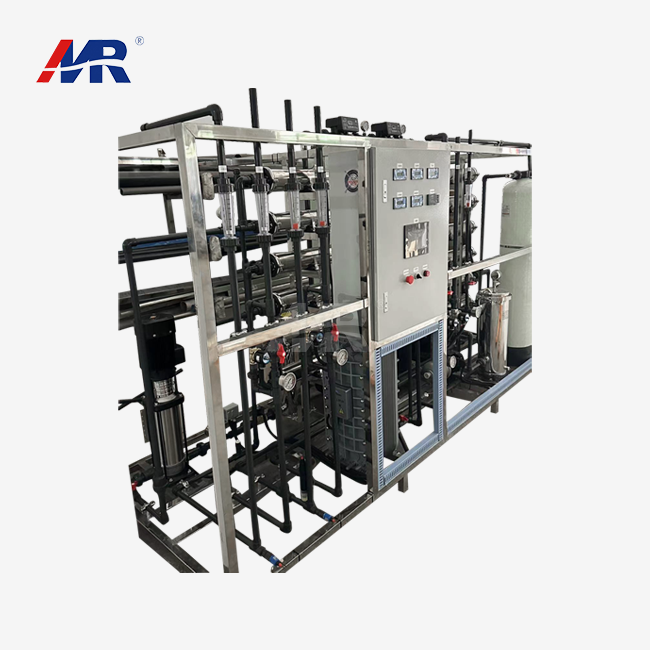 VIEW MOREedi water treatment system
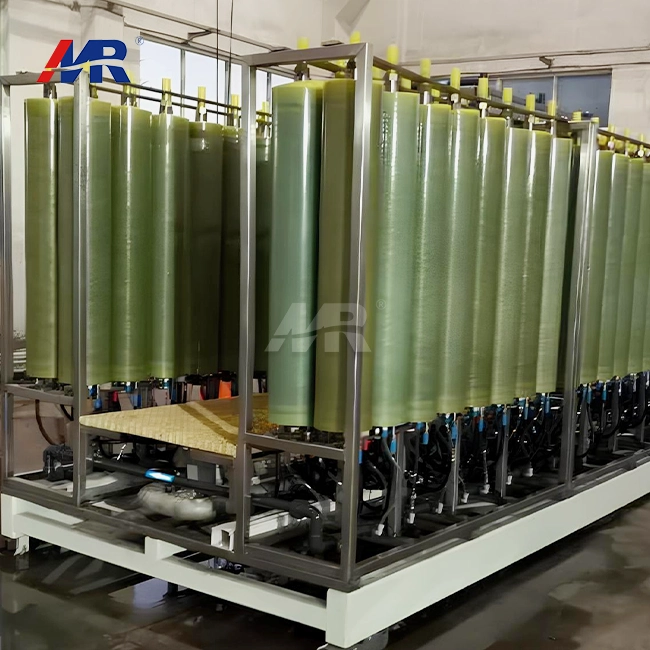 VIEW MOREDTRO for Wastewater Treatment