
_1745823981883.webp)

Brackish Water RO Design Strategies for Higher Recovery Rates
From membrane selection and preparation to energy management and brine removal, optimizing Brackish Water RO systems requires rethinking every step. When you deal with the reasons behind membrane fouling, scaling, and flux drop, you can get recovery rates higher than 75%. With the right planning, your facility can cut down on the amount of garbage it produces, save money on energy costs, and make membranes last longer. We've helped power plants, drug companies, and city utilities all over the world put these strategies into action, and the results have always been double-digit increases in business ROI and water efficiency.

Introduction
Because water is becoming harder to find and prices are going up, businesses need to treat water efficiently. Water systems that use Reverse Osmosis (RO) to turn fairly salty groundwater (usually with 1,000 to 15,000 mg/L of Total Dissolved Solids) into high-quality process or drinking water can deal with these problems. Unlike saltwater desalination, which needs very high pressures of more than 800 psi, brackish systems work at pressures between 150 and 400 psi, which saves energy while still removing more than 99% of the salt.
Optimizing your recovery rate has a direct effect on your bottom line. A 10% rise in recovery can mean a 15–20% drop in the cost of getting rid of brine and an equal drop in the cost of getting fresh water. Purchasing managers, plant engineers, and factory owners all know that higher recovery means less trash, less damage to the environment, and better compliance with regulations. To get recovery rates above 80% without damaging the membrane, however, the chemistry of the feed water, the design of the system, and the repair procedures must all be carefully thought out.
This guide comes from our work as a water treatment expert for a wide range of businesses, from making semiconductors to watering crops. We oversee more than 500 jobs every year across 14 regional branches, offering both membrane manufacturing and full installation services. Our objective is to give technical leaders methods they can use to improve recovery rates, lower the total cost of ownership, and make sure long-term system reliability in tough settings.
Understanding Brackish Water RO Systems and Recovery Challenges
In Brackish Water RO systems, thin-film composite (TFC) screens separate the water from the salts that are dissolved in it. Ionic species can't get through these semipermeable walls, but water molecules can. This makes a clean permeate stream and a concentrated brine release. Multi-stage setups, like 2:1 or 3:2 arrays, are often used in system design to gradually focus the feed stream while keeping crossflow speeds acceptable.
The recovery rate is the percentage difference between the extract volume and the feed volume. Standard brackish systems can recover 70–75% of their water, but going beyond this point causes engineering problems. The most common ones are mineral scaling from salts like calcium sulfate or barium sulfate that don't dissolve completely and concentration polarization, which happens when dissolved ions build up near the membrane surface. These things slow down the flow, raise the pressure across the membrane, and speed up membrane breakdown.
Fouling and Scaling: The Primary Bottlenecks
Colloidal fouling happens when particles in the fluid (measured by the Silt Density Index, SDI) stick to the membrane surface, closing holes and making it harder for fluids to pass through. A lot of the time, silica, iron oxides, or biological matter in industrial feed streams stick to surfaces and cause clogging. When solubility limits are crossed, mineral chemicals precipitate out and cause scaling. Usually, calcium carbonate, silica, and sulfate salts are to blame, especially when recovery rates are high and the quantity of brine increases.
Biological pollution happens less often in brackish environments, but it can happen in public water sources that have a lot of microbes. Biofilms hurt membrane function by raising the difference in pressure and encouraging erosion in certain areas. Different types of fouling need different ways to be stopped, and the best method depends on the type of water used, its temperature, and the way the system works hydraulically.
Economic and Environmental Stakes
The recovery rate has a direct effect on the amount of trash that is released and the chemicals that are used. When a textile plant is running at 75% recovery, 25% of its feed amount is turned into brine. When recovery is raised to 85%, brine production drops by 40%. This lowers the cost of dumping, which in controlled areas can be more than $15 per cubic meter. Higher recovery also lowers the amount of energy needed to pump and clean feed water, which saves money on utilities and cuts carbon emissions.
Across the world, regulations on how to get rid of salt are getting stricter. Facilities on land that can't get water from the ocean have to deal with concentrate by using evaporation ponds, deep well injection, or zero liquid release systems, all of which are pricey. Maximizing recovery reduces the amount that needs to be thrown away, which makes compliance easier and raises environmental measures that investors and stakeholders care about.
Key Design Strategies to Enhance Recovery Rates
To get recovery rates above 80%, you need to look at the quality of the feed water, the choice of membrane, the hydraulic design, and the working of the Brackish Water RO system as a whole. These tactics are tried-and-true interventions that we've used in a variety of workplace settings.
Feed Water Pretreatment Optimization
A key part of a high-recovery process is effective preparation. If you lower the SDI below 3.0 using multimedia filtration, cartridge filters, or ultrafiltration, the membranes will be safe from colloidal fouling. When it comes to high-recovery uses, ultrafiltration (UF) is the best way to get rid of particles with little chemical use. This is because even small amounts of suspended solids can cause fast fouling.
Scaling risk is taken care of by chemical treatment. Antiscalants, which are usually made up of phosphonates or polymaleic acid, stop crystal nucleation by stopping the formation of mineral lattices. The dose ranges from 2 mg/L to 5 mg/L, based on how hard the feed water is and how much silica is in it. Adding acid drops the pH, which makes calcium carbonate more soluble. This lets the brine contain more calcium without it precipitating. It is usual to change the pH to between 6.0 and 6.5, but careful tracking is needed to keep downstream pipes from corroding.
Advanced Membrane Selection
Low-fouling membrane chemicals and element designs made for higher flux tolerance are good for high-recovery operation. Some companies make salty membranes with negatively charged surface changes that keep anionic foulants away, which means they don't need to be cleaned as often. Larger diameter elements (16 inches vs. 8 inches) give you more membrane area per pressure tank, which lowers your capital costs and size.
To avoid too much concentration polarization, the operating flow should stay below 20 liters per square meter per hour (LMH). Too much flow speeds up fouling and scaling, which cancels out any recovery gains. We choose membrane elements that can reject at least 99.5% of salt to keep the quality of the permeate fixed, even at high recovery rates where the salty water level gets close to the saturation point.
Multi-Stage and Interstage Boost Configurations
Osmotic pressure builds up in the last steps of traditional single-pass devices, which limits how much they can recover. This problem can be solved with multistage systems that use interstage booster pumps to re-pressurize the concentrate stream between steps. Most two-stage systems work with a recovery rate of 50% in the first stage and 60–70% in the second, for a total recovery rate of 80–85%.
Interstage booster pumps make up for pressure loss and osmotic pressure rise so that there is still enough pushing power for permeation. Variable frequency drives (VFDs) let you precisely control the pressure, which keeps membranes from being over-pressurized, which can damage them. This setup works best with feed waters that are moderately hard and have TDS levels between 3,000 and 8,000 mg/L.
Optimizing Operating Pressure and Crossflow Velocity
Operating pressure needs to be just right to keep permeate output and membrane stress in balance. Too much pressure raises the flow, but it also speeds up the compression of membrane layers and increases the chance of mechanical failure. To make sure they last as long as possible, we aim for working pressures 10–15% below the manufacturer's highest rate. By watching the standardized permeate flow and salt passing in real time, changes that show the start of fouling or membrane damage can be found.
Concentration polarization is managed by crossflow velocity, which is the speed at which feed water moves perpendicularly across the membrane surface. When speeds are higher than 0.15 m/s, they push ions away from the membrane, which makes growth less likely. Getting the best crossflow often means changing the feed flow rates or the way the pressure vessels are set up, but the benefits are higher rebound potential and prolonged flux.
Energy Recovery Devices and Brine Management
Energy recovery devices (ERDs) take hydraulic energy from the concentrate stream and use it to power the system less, which cuts energy use by 30–40% total. When feed comes in, pressure exchanges move the pressure straight from the brine to the feed, and turbine-based ERDs turn hydraulic energy into mechanical shaft power. For systems that clean more than 50 cubic meters per hour, these devices are a good value because the money saved on energy costs covers the cost of the equipment within 18 to 24 months.
Getting rid of as much brine as possible through staged concentration improves healing even more. Through secondary RO passes, concentrate can be reused, and crystallization methods can be used to get back salts that can be used in industry or thrown away safely. Zero liquid discharge (ZLD) systems dry out brine, which produces solid salts and allows for almost complete water recovery, but they have high startup and running costs.
Case Studies: Successful Implementations of High Recovery Brackish Water RO Systems
Real-life examples show how customized design methods give real benefits that can be measured. The costs of getting rid of brine from a 500 GPM Brackish Water RO system were going up for a pharmaceutical company in the southwestern United States. The feed water from nearby wells had a high silica level (65 mg/L) and a TDS level of 4,200 mg/L. At 75% recovery, standard operation made 125 GPM of concentrate that had to be injected deep into the ground at a cost of $18 per cubic meter.
We changed the system so it has two stages, an interstage booster pump, and a better antiscalant program that controls silica. Instead of using regular media filters, UF preparation was used, which lowered SDI from 4.5 to below 2.5. It was made so that the operating flow was 18 LMH, and membrane elements with low-fouling surface chemistry were put in. Recovery went up to 85%, which cut the amount of brine to 75 GPM and cut the cost of dumping by $230,000 a year. The time between cleanings of the membranes went from 90 days to 180 days, which further reduced running costs.
A regional water company that serves a coastal town put in place high-recovery brackish RO to clean up groundwater that had been impacted by seawater seepage. Feed TDS averaged 3,800 mg/L, but it changed with the seasons. The company needed 2 MGD of drinkable water that met EPA guidelines. It was set up in three stages with air separators, and 82% recovery was achieved. The energy use was 0.9 kWh per cubic meter, which is 30% less than usual forms. The company didn't have to drill any more wells, which saved them $2.3 million in capital costs.
Maintenance Best Practices to Sustain High Recovery Rates
To keep the Brackish Water RO system successful over its working life, it needs to be carefully maintained along with a well-thought-out design. Key performance measures that are constantly being watched give early warning of fouling or scaling. The normalized permeate flow, salt passage, and differential pressure are compared to numbers that were set during setup. Deviations of more than 10% for flow or 15% for pressure should be looked into and fixed.
Automated Monitoring and Predictive Analytics
Flow, pressure, conductivity, pH, and temperature monitors are built into modern control systems at a number of different measurement points. Data logging lets you look at trends, which show you how performance is slowly getting worse before it affects production. Predictive analytics algorithms, which are often in the cloud, look at real-time data and compare it to practical models to figure out how much cleaning will be needed and how to best dose chemicals. These tools cut down on the work that needs to be done by hand and on unexpected downtime.
Cleaning-in-Place (CIP) Protocols
Effective CIP improves membrane permeability by breaking down or moving foulants that have built up. How often you clean and what kind of cleaner you use depend on the type of dirt. Biofilms and organic waste can be removed by alkaline cleaners (pH 11–12) that use detergents and chelating agents. Mineral scales like calcium carbonate or iron oxides can be broken down by cleaners that are acidic (pH 2–3). High-temperature CIP (up to 35°C) makes cleaning more effective, but it needs filters that work with it.
A normal CIP operation includes flushing, soaking, rinsing, and recirculating the cleaning solution for 30 to 60 minutes. To avoid damage, the pressure is kept low (below 60 psi). After cleaning, checking the pressure and flux levels to make sure they are back to normal is important. We suggest keeping detailed CIP logs to see how well the cleaning is working and to find fouling trends that keep happening that might need pretreatment changes.
Membrane Autopsy and Root Cause Analysis
If cleaning doesn't improve performance, a membrane biopsy gives a clear explanation. Elements that are meant to be sacrificed are taken out and sent to specialized labs to be analyzed physically, chemically, and biologically. Energy-dispersive X-ray spectroscopy tells us what the elements are made of, while scanning electron microscopy shows us surface layers. This information helps with specific correction steps, like changing the ingredients in antiscalant mixtures or improving the pretreatment.
Procurement Considerations for High-Recovery Brackish Water RO Systems
Finding the right Brackish Water RO system and provider means finding a balance between technical requirements, cost, and long-term assistance. Recovery rate goals need to be in line with the features of the feed water and the limitations of the spot. Asking for a full water study and trial testing lowers the risks of scaling or fouling.
Technical Specifications and Performance Guarantees
Reliable providers offer performance warranties that cover the flow of permeate, the rejection of salt, and the recovery rate under certain feed circumstances. Guarantees should last for at least one year after the project is finished, and there should be ways to fix problems if the goals aren't met. Membrane warranties usually last between three and five years, but only if the suggested cleaning and working procedures are followed.
The energy economy is a very important feature. Systems with variable speed drives, energy recovery devices, and efficient hydraulic designs save money over their entire lifetime, which more than makes up for the higher original investment. Ask for energy use information in kWh per cubic meter so that you can compare providers accurately.
Financial Analysis: Upfront Costs Versus ROI
Because they have more stages, interstage pumps, and more advanced preparation, high-recovery systems cost 15–25% more to build than normal designs. A total cost of ownership (TCO) study should include the savings in energy, chemicals, and the amount of brine that needs to be thrown away. High-recovery changes usually pay for themselves in two to four years, but this depends on how much it costs to get rid of the brine and how much the utilities cost in your area.
Capital costs are spread out over the useful life of the tools by financing choices like leasing and performance-based contracts. Some sellers offer Energy Savings Performance Contracts (ESPCs), which promise savings and lower financial risk for buyers on a budget.
Supplier Reliability and After-Sales Support
Global seller networks make sure that spare parts and expert help are delivered on time. Check out suppliers based on their service infrastructure, installed base, and knowledge in the business. Complex high-recovery systems need to be set up on-site, operators need to be trained, and there needs to be 24/7 online help. References from similar applications show how reliable and quick something will be in the long run.
Logistics for replacing membranes need to be looked at. Custom membrane configurations can have lead times of more than 12 weeks. Keeping a smart store of important spares on hand keeps production from stopping, which costs a lot of money. Suppliers that offer predictive maintenance programs use data on performance to plan preventative actions that keep fixes from having to be done in an emergency.
Conclusion
In order to achieve recovery rates above 80% in Brackish Water RO systems, combined methods that take into account the quality of the feed water, membrane technology, system hydraulics, and maintenance rigor are necessary. High-recovery designs are appealing to businesses that have trouble getting enough water and getting rid of waste because they save money and time by reducing the amount of salt used, using less energy, and making membranes last longer. We have shown that careful pretreatment, improved membrane selection, multi-stage setups, and maintenance that is based on what will happen next can lead to long-term performance gains. When business leaders put these design principles at the top of their list of priorities, they set up their operations for long-term efficiency, legal compliance, and a competitive edge in markets with limited resources.
FAQ
1. What factors most influence recovery rate potential in brackish RO systems?
The most that can be recovered depends on the chemistry of the feed water and how much scaling ions like calcium, barium, and silica are present. Effective preparation lowers the SDI below 3.0, and the right dose of an antiscalant raises this limit. The working pressure and the shape of the membrane part are also very important.
2. How does brackish water RO differ from seawater RO in terms of recovery?
Seawater RO usually only gets 40–50% recovery because the TDS is so high (35,000 mg/L or more) and the osmotic pressures need to be 800–1,200 psi. When designed correctly, brackish systems can recover 75–85% of the TDS and pressures that are present.
3. What routine maintenance extends membrane lifespan in high-recovery applications?
Monitoring standardized flow and differential pressure all the time finds fouling early. Cleaning-in-Place with the right chemicals every 90–180 days stops fouling that can't be fixed. Keeping the feed SDI below 3.0 and keeping temperature changes under control are also ways to protect the membrane's health.
4. Can existing brackish systems be retrofitted for higher recovery?
You can improve a lot of systems by adding interstage booster pumps, making the preparation better, or switching out membranes for ones that don't collect gunk. A full check of the feed water quality, hydraulic design, and membrane state tells us if a retrofit is possible and what the projected return on investment (ROI) is.
Partner with Morui for Optimized Brackish Water RO Solutions
Guangdong Morui Environmental Technology can help you with your high-recovery problems because they have been treating water for 20 years. We provide turnkey systems that are suited to your feed water chemistry and operating goals as a combined Brackish Water RO manufacturer with our own membrane fabrication facility and equipment processing plants. Our 20 engineers work in 14 branches and have implemented solutions for clients in the pharmaceutical, semiconductor, power production, and municipal sectors around the world. They have regularly achieved recovery rates of more than 85% and saved documented amounts of energy. We offer the dependability and creativity that your operations need, whether you need a unique high-recovery design, a system retrofit, or ongoing Technical support. Email our technical team at benson@guangdongmorui.com to talk about the needs of your project and ask for a thorough estimate.
References
1. Greenlee, L.F., Lawler, D.F., Freeman, B.D., Marrot, B., & Moulin, P. (2009). Reverse osmosis desalination: Water sources, technology, and today's challenges. Water Research, 43(9), 2317-2348.
2. Wilf, M., & Bartels, C. (2005). Optimization of seawater RO systems design. Desalination, 173(1), 1-12.
3. American Water Works Association. (2007). Reverse Osmosis and Nanofiltration (M46) (2nd ed.). Denver: AWWA.
4. Peñate, B., & García-Rodríguez, L. (2012). Current trends and future prospects in the design of seawater reverse osmosis desalination technology. Desalination, 284, 1-8.
5. Fritzmann, C., Löwenberg, J., Wintgens, T., & Melin, T. (2007). State-of-the-art of reverse osmosis desalination. Desalination, 216(1-3), 1-76.
6. Karabelas, A.J., Koutsou, C.P., & Kostoglou, M. (2015). The effect of spiral wound membrane element design characteristics on its performance in desalination—A parametric study. Desalination, 332, 76-90.
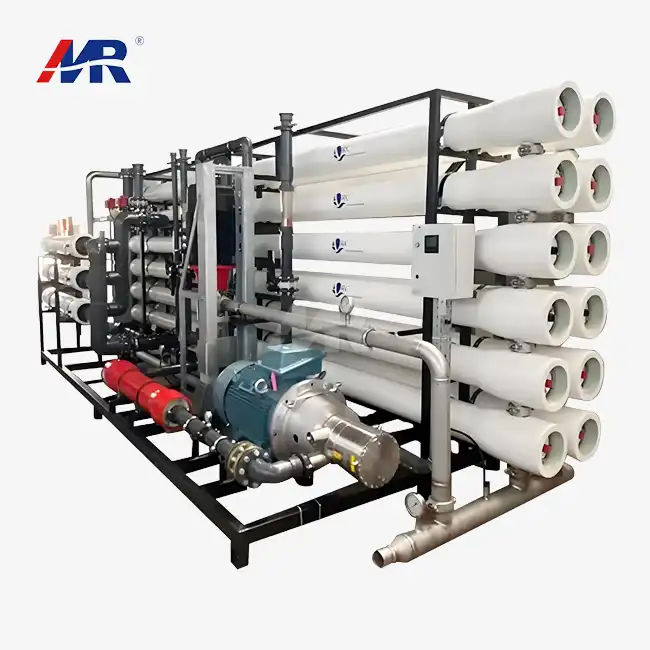 VIEW MORE45m3/hour seawater desalination system
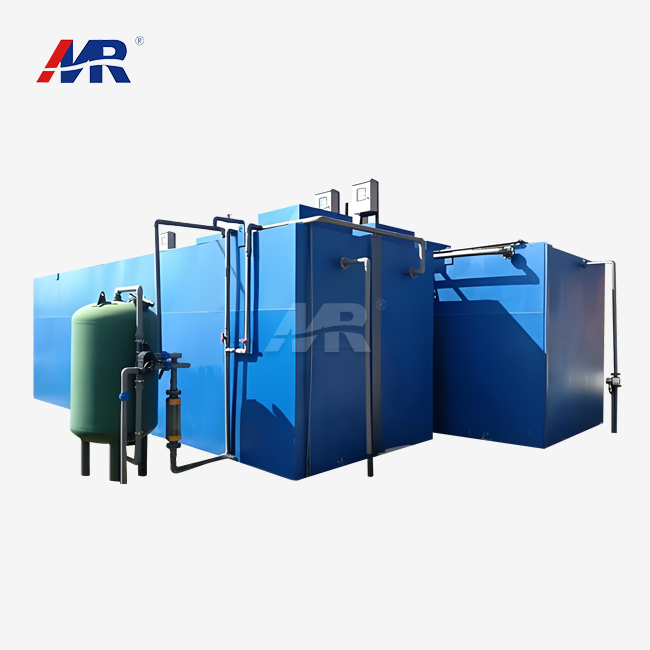 VIEW MOREsewage treatment plant
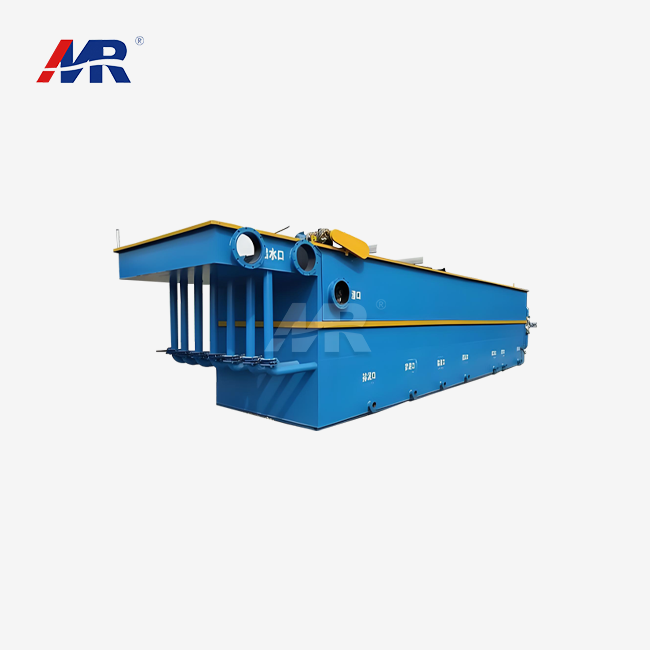 VIEW MOREadvanced wastewater treatment system
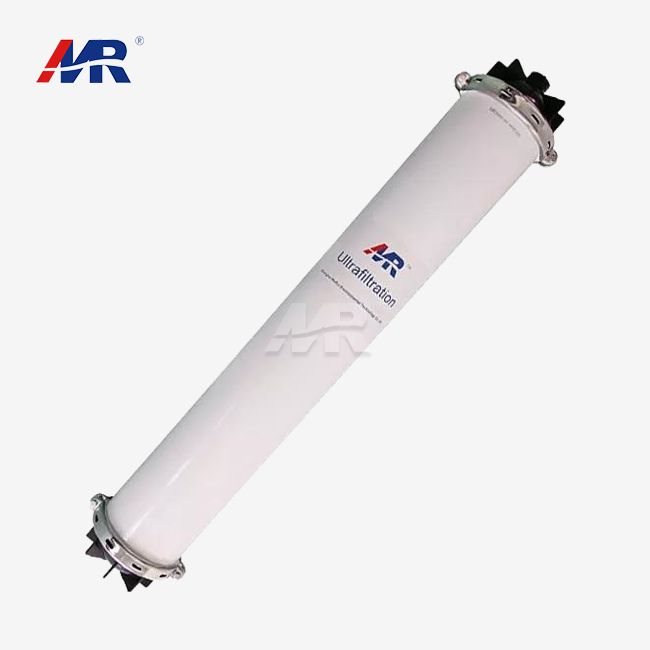 VIEW MOREultrafiltration membranes for water treatment
 VIEW MORELeachate DTRO Treatment Equipment
 VIEW MOREbiological reactor wastewater treatment
 VIEW MOREswro membrane
 VIEW MOREedi system in water treatment