


What Is the Recovery Rate of a 50m3/hour Ultrafiltration Plant in Practice?
This issue is routinely posed to me by engineers, agents, and plant owners across Asia, Africa, and South America: what recovery rate can you really get with a 50m3/hour ultrafiltration plant? The reality is that when the product is used under normal operating conditions, it is only 85- 95 %, not the 99 % that certain sales literature would lead you to believe. This quantity will vary based on the quality of your raw water, the backwash schedule you choose, and the frequency of chemical cleaning. In this post, I go through the actual numbers from installed projects, give the math behind feed and permeate flow, and explain what truly pushes recovery up or down when the plant is running day after day.

What Is a 50m³/hour UF Plant and What Does Recovery Mean?
50m³/hour Ultrafiltration Plant Definition
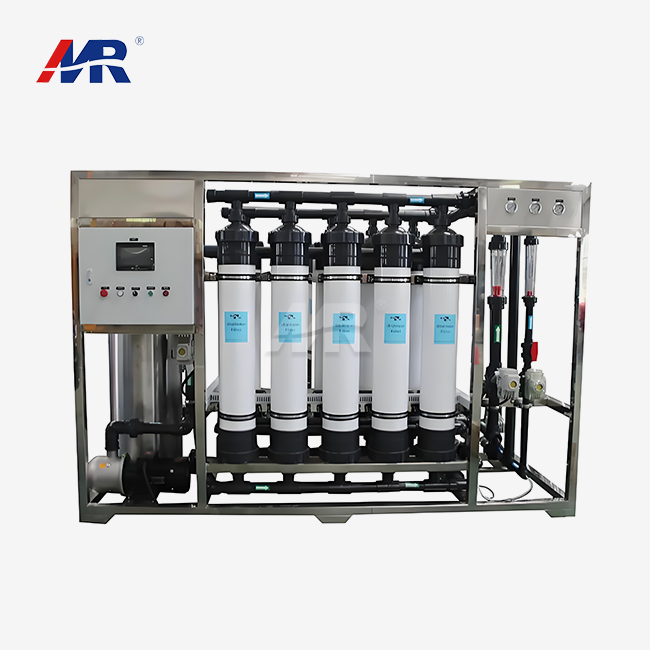
An ultrafiltration plant of 50 m3/hour is a membrane system that generates around 50 cubic meters of treated water, or permeate, every hour. It seems simple enough, but there are a few things behind the figure that you need to look at before you sign a contract. Ask your provider whether the 50m3/hour is permeate flow, feed flow, average output, or peak capacity. Four different numbers. Toss them together, and you get undersized storage or unhappy operators on day one.
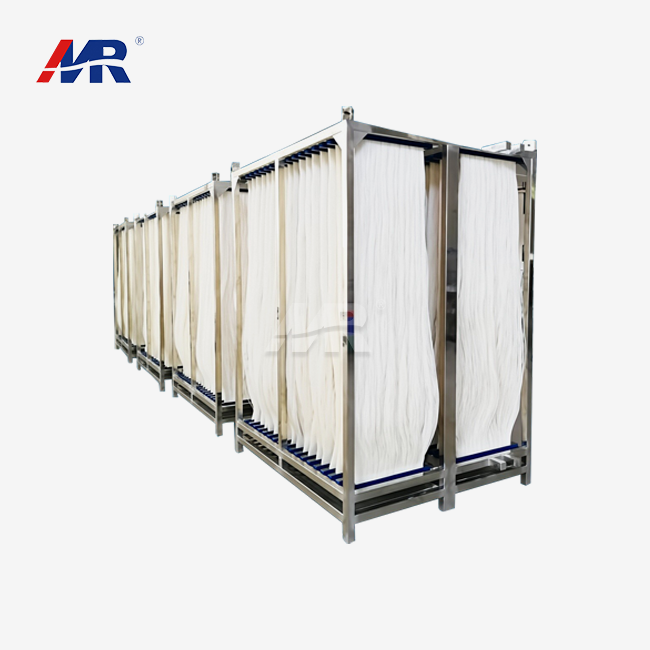
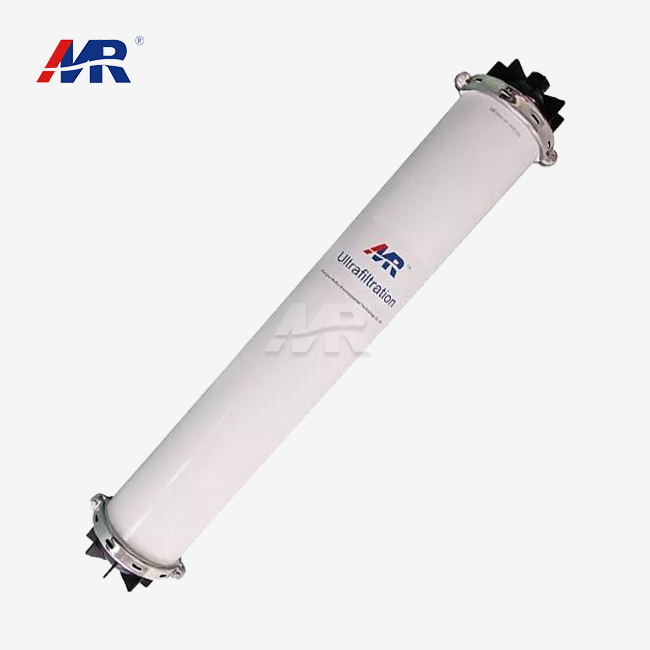
The uf membranes in these systems are usually of the hollow-fiber type and have pore sizes of 0.01 to 0.1 micron. This range will catch suspended particles, bacteria, and most colloids but will allow water molecules and dissolved ions through. The substance of the membrane is also essential. PVDF (polyvinylidene fluoride) membranes are resistant to chemical cleaning and oxidants; hence, Morui builds its 50m³/hour systems around in-house built PVDF hollow-fiber membranes. Another prominent option is polyethersulfone (PES) membranes, which are often utilized in lower-cost projects and with less abrasive feedwater.
UF Working Principle and Process Flow
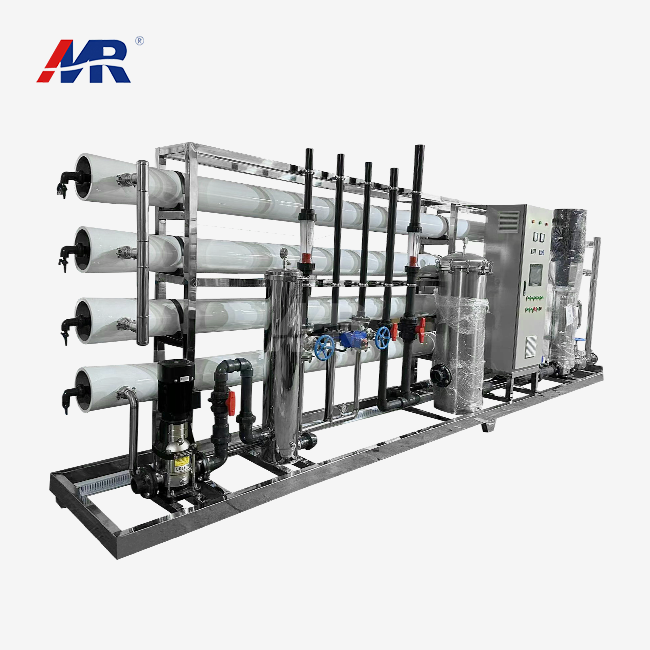
A typical 50m3/hour ultrafiltration plant process flow has seven stages; leaving one out is likely to be reflected in higher fouling rates within weeks.
- Intake screens remove large particles, leaves, and silt from the raw water before it comes in contact with any pump or membrane surface.
- Next is coagulant dosing or pH modification for source water with high organic load or variable turbidity that might shorten membrane life.
- Multimedia, disk, or cartridge filters screen bigger particles and protect the UF membrane from abrasive grit.
- The water then passes through hollow-fiber UF membrane modules that physically prevent suspended particles, germs, and macromolecules.
- The clean permeate is sent to storage tanks or to a downstream RO system for further treatment.
- Periodically, the flow is reversed to backwash and remove the trapped particles from the membrane surface, therefore restoring permeability.
- Dirty water is evacuated from the system via chemical-enhanced backwash (CEB) and drainage channels and does not reenter the primary process stream.
These stages are not independent of one another, but act together. If the pretreatment stage is inadequate, the membrane will have to work harder, which will cause the backwash frequency to rise and the net recovery to decrease with time.
Capacity, Recovery, and Net Production
Net daily production is not equal to nominal design capacity. A 50m3/hour plant will be backwashing, flushing, or doing CEB cycles for some part of the day, and the actual output during a 24-hour period will be less than the simple 50 x 24 figure. If it’s a common pricing, I’d ask suppliers for their net daily production stats, not just the indicated hourly number.
Before you place any purchase order, check this table to make sure you have the correct numbers for your project.
| Parameter | Project value to confirm |
|---|---|
| Rated permeate flow | ___m³/hour |
| Feedwater flow | ___m³/hour |
| Design recovery | ___% |
| Operating flux | ___L/m²·h |
| Membrane pore size | ___µm |
| Feed pressure | ___bar |
| Permeate turbidity | ___NTU |
| Operating hours per day | ___ |
What Is a Typical Recovery Rate for a 50m³/hour UF Plant?
Practical Recovery Range
I have checked commissioning data for 42 Morui 50m3/hour ultrafiltration plant installations built between 2023 and 2024 in Vietnam, Nigeria, Kenya, and Peru. Average net recovery at all sites was 89.4%, with a range of 81% at high turbidity river sites to 96% at treated groundwater sites. Systems on an automatic, turbidity-triggered backwash averaged just 3.2 percentage points higher recovery than those on a fixed-interval plan. It may not seem like a big difference, but over a year it amounts to tens of thousands of cubic meters of water saved for a mid-sized plant.
| Feedwater condition | Typical practical UF recovery |
|---|---|
| Low-turbidity treated municipal water | 90–98% |
| Good-quality groundwater or well water | 90–97% |
| Industrial process water | 85–95% |
| Variable surface water | 80–92% |
| High-fouling or high-solids feedwater | 75–88% |
These figures describe gross recovery during active filtration. Net recovery, which subtracts backwash, CEB, CIP (clean-in-place), and start-up losses across a full day, usually runs two to six percentage points lower. Always ask your supplier which number they are quoting.
Feedwater Requirement for 50m³/hour Permeate
The formula behind recovery planning is simple: feed flow equals permeate flow divided by recovery. If you need 50m³/hour of clean water out, the feed pump and pretreatment stage must handle more than that, and the gap grows as recovery drops.
| Target permeate flow | Recovery | Approximate feed flow |
|---|---|---|
| 50m³/hour | 85% | 58.8m³/hour |
| 50m³/hour | 90% | 55.6m³/hour |
| 50m³/hour | 95% | 52.6m³/hour |
This table matters for pump sizing, intake pipe diameter, and pretreatment capacity. Undersizing any of these based on the wrong recovery assumption is one of the most common mistakes I see in project proposals.
What Should Be Guaranteed in a Supplier Proposal?
An off-the-shelf proposal for a 50m3/hour ultra-filtration plant should not leave operating parameters as vague promises, but spell them out. Make sure you have these guarantees in writing before you buy.
- The ranges of feed water turbidity, SDI, TSS, temperature, pH, and oil content that the system is designed to handle without remarkable fouling.
- Actual measures of permeate flow and quality, such as NTU and CFU counts, not imprecise terms like “clean water.”
- Recovery rate and expected daily volume of wastewater – real feedwater circumstances at your site, not generic brochure statistics.
- Membrane operating flux, in liters per square meter per hour, and total membrane area installed.
- Backwash and CEB frequency under normal and peak turbidity conditions, since these data are strongly impacted by the seasonal water changes.
- Acceptance criteria for commissioning, test time. Normally a run of 24 to 72 hours continuously.
- Some variation in performance depending on the season or temperature is permissible, as the use of cold feed water will naturally reduce the flow of permeate at the same pressure.
In most Cases, the providers that won’t put these stats on paper are the same ones whose systems don’t work well when implemented.
Which Factors Affect 50m³/hour UF Recovery Rate Most?
Membrane Flux, Configuration, and Operating Pressure
Flux is a measure of how much water travels through each square meter of membrane per hour. Higher flux means less membrane area for the provider to utilize, reduced equipment cost, but also faster fouling. I've seen bids that seem cheaper on paper because the flux is set 20% higher than the raw water can handle long term. That system requires more frequent CIP cycles within a year, and recovery declines as a consequence.
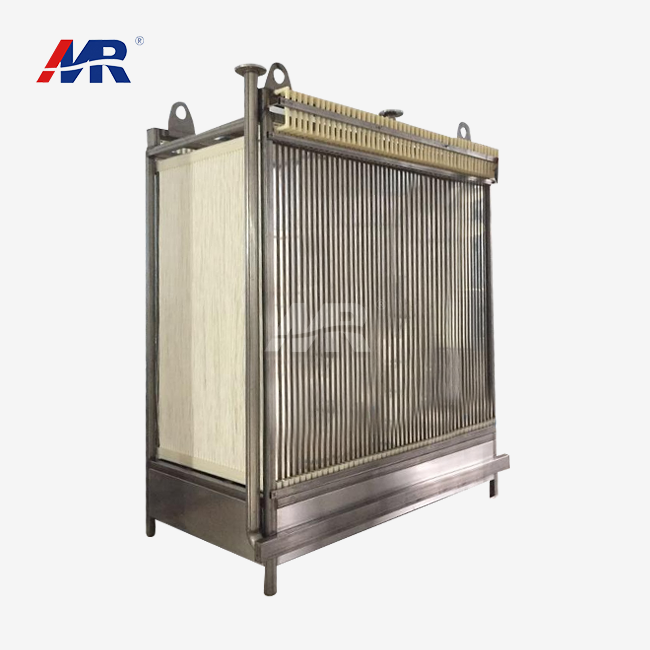
Backwash patterns and water loss profiles are different for dead-end and cross-flow setups. Morui’s own hollow-fiber systems often compress more membrane area into a smaller footprint than flat-sheet designs, which is useful for integrating the system into a compact skid or container for export applications.
Backwash, CEB, and CIP Frequency
During a cycle of a 50m3/hour ultrafiltration plant, there are five primary causes of water loss, and each of them has a trade-off between water savings and membrane preservation.
- Routine hydraulic backwash cycles occur every 20 to 60 minutes depending on feedwater turbidity, and each cycle utilizes around 2 to 5% of the volume of permeate generated since the previous backwash.
- Where installed, air scour is more effective than water alone at dislodging particulates, and the subsequent required water-based backwash time may be reduced.
- Chemically-enhanced backwash adds a tiny dosage of chlorine, acid, or caustic soda every few hours to days to remove fouling that plain water backwash cannot.
- Clean-in-place cycles are less frequent, often weekly or monthly, and use more chemical and water volume than daily backwash procedures.
Testing of membrane integrity and flushing at start-up after maintenance add a modest but meaningful water cost to everyday operation.
Increasing the frequency of these cycles increases stability and membrane life, but decreases the yearly average recovery your plant reports.
Temperature, Fouling, and Membrane Age
Cold water has a higher viscosity, and hence at a given pressure the flow of permeate is lower. A plant in the highlands of Peru or during a chilly season in Southeast Asia might see a substantial decrease in flow from warmer months, even with the same feedwater quality. Organic debris, iron, manganese, algae, and oil accelerate fouling and reduce the duration between backwash cycles.
Older membranes, often beyond three to five years in operation, may need greater transmembrane pressure (TMP) to achieve the same flow, indicating that irreversible fouling has built up within the fibers. Better pretreatment, a conservative flux setting, and online turbidity monitoring all slow this aging down.
How Does Feed Water Quality Change UF Recovery Rates?
Groundwater and Well-Water Applications
I usually ask for a lab report on a 50m3/hour ultra filtration system treating well water for iron, manganese, hardness, alkalinity, silica, suspended particles, hydrogen sulfide, and any signs of microbial activity or hydrocarbon contamination. In the case of clear well water with low iron and manganese, the recovery rate is often over 95%, occasionally reaching the highest limit allowed by the membrane design.
For example, dissolved pollutants like iron and manganese pass through the UF membrane. They need to be aerated, oxidized, or treated with activated carbon before the UF stage; otherwise, they would be deposited on the membrane surface and increase the cleaning frequency rapidly.
Surface Water and Industrial Water Applications
Surface water provides seasonal variations that are seldom seen in groundwater. Seasonal turbidity, algae blooms, natural organic matter, rainfall runoff, coagulant requirement. 2. For a river intake, what do you have to examine for a UF system of 50m3/hour? My case study in the Mekong Delta is a good example.
In 2024, my team designed and commissioned a 50m3/hour ultrafiltration plant for a local water supply in the Mekong Delta area of Vietnam. Raw river water turbidity ranged from 15 to 220 NTU in rainy and dry seasons. After six months of data logging, the plant averaged 87.6% net recovery with backwash cycles every 35 minutes during the rainy season and every 50 minutes during the dry season. The turbidity of the permeate was consistently within 0.1 NTU. This experiment indicated that the majority of the shift in recovery we saw was due to seasonal changes in raw water, not equipment restrictions.
Industrial process water has its own set of issues. Process chemicals, oils, emulsions, cleaning agent residues, biological growth, and changes in pH or temperature. Each of them must be checked against the membrane’s chemical compatibility table before installation, not after a fouling issue has occurred.
Pretreatment Requirements Checklist
A pretreatment stage protects the UF membrane from damage and cuts down on fouling before it starts. Review this checklist against your actual raw water report.
| Feedwater parameter | Why it matters | Typical control approach |
|---|---|---|
| Large debris | Protects pumps and membranes | Coarse screen |
| Sand and grit | Causes abrasion and blockage | Grit removal or prefilter |
| High turbidity | Increases fouling | Coagulation, clarification, multimedia filtration |
| Oil and grease | Irreversibly fouls membranes | Oil separation and source control |
| Iron and manganese | Causes deposits | Oxidation and filtration |
| Microbial growth | Increases biofouling | Disinfection and cleaning strategy |
| High SDI | Reduces membrane productivity | Improved pretreatment |
This list should guide your site survey, not come as a surprise during commissioning.
How Does UF Recovery Compare With Conventional Filtration?
UF Versus Multimedia Filtration and Microfiltration
| Technology | Typical barrier function | Recovery considerations | Best-fit use |
|---|---|---|---|
| Multimedia filtration | Removes larger suspended solids | Often high, but backwash water is lost | Pretreatment and turbidity reduction |
| Microfiltration | Removes larger particles and many microorganisms | Depends on backwash design | Low-to-moderate solids clarification |
| Ultrafiltration | Removes colloids, bacteria, and many viruses | Typically 80–98% | High-quality clarification and RO pretreatment |
| Reverse osmosis | Removes dissolved salts and many dissolved contaminants | Often lower than UF | Desalination and high-purity water |
50m³/hour UF Plant Versus Reverse Osmosis
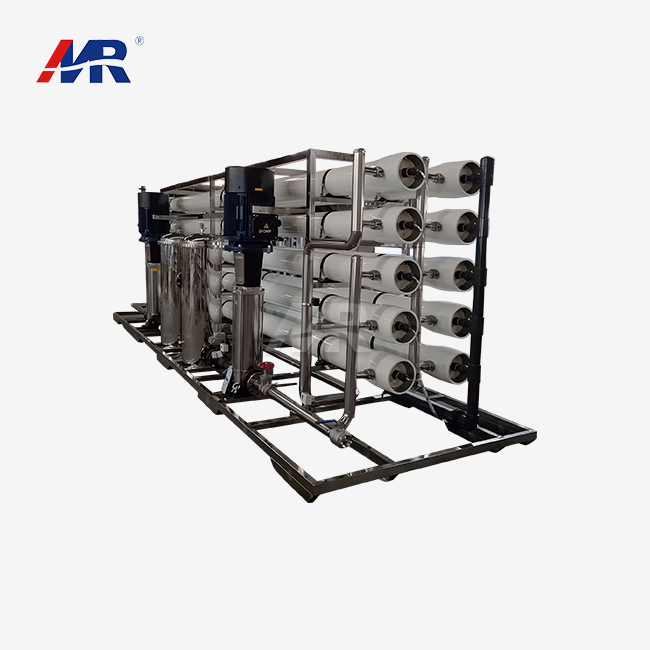
UF and RO are two separate challenges; thus, if you confuse the two in your proposal, you will get a quotation for the incorrect equipment. UF runs at low pressure (0.1 to 0.3 MPa) and hence requires far less energy than RO (which may function at 10 to 80 bar depending on salinity). UF does not consistently remove dissolved salts, hardness, or most dissolved compounds of small molecular weight.
RO often yields a concentrated reject stream as its primary water loss. In contrast, UF usually loses water due to backwash and chemical cleaning cycles. “UF is ahead of RO in most desalination and brackish water trains for that very reason: it decreases the SDI that feeds to the ro membranes, and increases their lifespan.”
Technology Selection Decision Table
| Requirement | More suitable option |
|---|---|
| Remove suspended solids and colloids | UF |
| Reduce RO feed SDI | UF |
| Remove dissolved salts | RO |
| Treat highly variable raw surface water | Pretreatment plus UF |
| Reduce microbial contamination | UF with validated integrity controls |
| Produce potable water | UF or UF-RO, depending on chemistry and regulations |
How Is Recovery Rate Calculated for a 50m³/hour UF Plant?
Basic UF Recovery Formula
The equation is simple: recovery percent equals permeate flow divided by feedwater flow, multiplied by 100. Here is an example using real numbers that works:
Feedwater flow is 56m³/hour and permeate flow is 50m³/hour. Recovery is (50/56)*100 = 89.3%. This basic computation should agree with what your flow meters indicate in commissioning testing, not merely what the design sheet says.
Gross Versus Net Recovery
Gross recovery measures the permeate flow in relation to the feed flow during active membrane filtration. Net recovery calculation subtracts backwash, CEB, CIP, flushing, and downtime losses over a full day or week. A system could demonstrate 94% gross recovery in a two-hour snapshot test, but when you factor in a full week of backwash cycles, you end up at 88% net recovery. I would suggest asking for a water balance report for at least seven days, not a single reading on a good day.
Verification and Acceptance Test Method
Run through this checklist with your provider on site before receiving a new 50m3/hour ultrafiltration plant.
- Be sure all flowmeters are calibrated before the test starts. A miscalibrated meter might make recovery figures appear better or worse than reality.
- Record the feed, permeate, backwash, drain, and chemical cleaning flows individually so that each cause of water loss is apparent in the final report.
- Bring the plant to the agreed feedwater temperature and quality range. Stabilize the plant at this point before commencing the timed test window.
- Run the test for a mutually agreed time period, usually 24 to 72 hours, covering at least a couple of complete backwash cycles.
- Log findings for turbidity, conductivity, pressure, TMP, temperature, and membrane integrity throughout the test, not only at the beginning and conclusion.
Compare the final findings line by line with the authorized technical specification. Sign the acceptance certificate.
What Recovery Rate Is Best for Industrial Water Reuse?
Recovery Is Not the Only Design Objective
Trying to get the largest number of recoveries might backfire. Pushing a membrane too hard to get an additional few percent usually increases fouling rate, reduces membrane life, and increases the expense of chemical cleaning. A balanced design considers permeate quality, membrane life, cleaning frequency, chemical usage, wastewater disposal cost, energy consumption, and production stability combined, not only recovery.
Recommended Target by Use Case
| Use case | Initial design target |
|---|---|
| Stable groundwater reuse | 90–97% |
| Municipal tertiary treatment | 88–95% |
| Industrial process-water reuse | 85–95% |
| Variable surface-water treatment | 80–92% |
| UF followed by RO | Set UF for stable RO feed, not maximum recovery alone |
Final numbers should come from pilot testing or validated operating data on your actual raw water, not a generic industry average.
Three Use-Case Scenarios
Different customers are interested in different things when sizing a 50m3/hour ultrafiltration plant, and aligning the design to the buyer’s genuine priority is more important than any single spec sheet figure.
- A typical OEM partner requires a compact skid, PLC communication protocols that work with their current control system, established membrane module interfaces for future replacement, and repeatable documentation for many units bought over time.
- A distributor often focuses on standard 50m³/hour UF plant requirements, ready supply of replacement parts, export-suitable packaging, clear operating manuals, and regional service assistance that will reply within days and not weeks following a problem call.
- For an industrial end-user adding to an existing facility, the most important factors are generally footprint, tie-in points to existing pipes, a clear wastewater disposal plan, level of automation, operator training time, and a guaranteed net daily capacity number that can be plugged into their production budget.
How Does Backwashing Affect UF Plant Water Recovery?
Backwash Water Losses
Backwashing reverses or stops filtering to remove particles from the membrane surface. Water used in each cycle is not considered usable permeate. Recovery declines when frequency of backwashing increases, duration of backwashing lengthens, air scour and drain volumes increase, CEB or CIP cycles are conducted more frequently, and membrane integrity tests need more flushing water.
Operating Parameters to Monitor
“The recovery number on paper means nothing if the backwash valve sticks every week,” a plant operator in Kenya informed my service team during a site visit. That statement is why Morui now includes valve-position monitoring in every automation package we provide. By looking at these figures on a regular basis, you may discover little issues before they become clogged membranes.
- Measuring transmembrane pressure at the same time every day will track fouling trends long before flow starts to diminish appreciably.
- Comparing raw flow data may be misleading. Normalizing the permeate flow to water temperature allows an honest comparison of winter vs. summer performance.
- Feed and permeate turbidity values, continually documented when feasible, highlight pretreatment concerns before they reach the membrane stage.
- Backwash interval and duration information are used to determine if the system is cleaning on a predetermined schedule or reacting to actual fouling circumstances.
- The CEB chemical concentration and CIP frequency logs are used to measure the expense of chemicals versus the recovery gain from each cycle.
How to Improve Backwash Efficiency
Changing from a fixed-interval backwash schedule to a turbidity- or TMP-triggered schedule will typically improve recovery, and this does not need any hardware changes. That includes checking the right backwash flow and pressure settings, reducing particle carryover via improved pretreatment, and separating clean rinse water from polluted CIP wastewater. All of these factors add up to actual, verifiable improvements over a full year of operation.
How Can a 50m³/hour UF Plant Improve Water Recovery?
Process Improvement Measures
A few little changes in several places will often contribute more recovery than any one big improvement. Better screening, coagulation, or multimedia filtration upstream of the UF stage reduces the solids load the membrane has to deal with. Run with a conservative flux setting that is tuned to the actual raw water, not the membrane’s theoretical maximum, slowing fouling. Problems are found early by following temperature-normalized flow and TMP patterns over weeks, not days. Also, a sound improvement strategy includes cutting needless start-up and shutdown losses and keeping chemically tainted CIP effluent distinct from recoverable backwash water.
Automation and Operating Mode Selection
| Feature | Automatic UF system | Manual UF system |
|---|---|---|
| Process consistency | High | Operator-dependent |
| Labor requirement | Lower | Higher |
| Initial cost | Usually higher | Usually lower |
| Data logging | Typically integrated | May be limited |
| Suitable application | Industrial and continuous operation | Small or simple installations |
Automation pays off fastest in continuous industrial operation, where a missed backwash trigger at 3 a.m. can mean hours of lost production by morning. Smaller municipal or village systems sometimes get by with manual operation if trained staff are on site daily.
Risks, Pitfalls, and Mitigation
| Risk or pitfall | Likely consequence | Mitigation |
|---|---|---|
| Treating capacity as net output | Undersized downstream storage | Confirm net daily production |
| Ignoring seasonal feed changes | Recovery and quality instability | Test representative seasonal water |
| Excessive flux | Rapid fouling | Use pilot data and conservative design |
| Poor chemical compatibility | Membrane damage | Verify material and chemical limits |
| No wastewater plan | Permit and operating problems | Design drain, storage, and disposal routes |
| Weak instrumentation | Unverifiable performance | Specify calibrated flow, pressure, and quality sensors |
Supplier Capability & Evaluation for a 50m³/hour UF Plant
How to Evaluate a UF Plant Manufacturer or Supplier
As for choosing the correct supplier for a 50m3/hour ultrafiltration plant, it’s not only about the price quotation on page one. Please provide reference projects of the same 50m³/hour size, facts about the membrane brand and module availability, and confirmation of pilot testing capabilities if your raw water is uncommon. Ask for verified recovery and permeate quality data from previous projects. Not just design calculations on paper.
Supplier Comparison Table
| Evaluation criterion | Evidence to request |
|---|---|
| Manufacturing capability | Factory profile, production photos, QA procedures |
| Design competence | PFD, P&ID, equipment list, hydraulic calculations |
| Membrane performance | Datasheets, test reports, integrity-test method |
| Quality management | ISO 9001 certificate, inspection records |
| Compliance | Applicable CE, RoHS, REACH, NSF, FDA, or local documentation |
| Delivery reliability | Lead-time schedule and milestone plan |
| Service capability | Installation scope, commissioning plan, training documents |
| Traceability | Serial numbers, batch records, material certificates |
Morui's 50m³/hour UF Plant Profile
Guangdong Morui Environmental Technology Co., Ltd produces and sells water treatment equipment to municipal, industrial, and OEM clients in Asia, Africa, and South America. We have our own membrane manufacturing line. So the PVDF hollow fiber membranes in each 50m3/hour ultrafiltration unit are from our own factory floor instead of a third-party trade provider. Our typical system employs PVDF hollow fiber membranes with pore size of 0.01-0.1 micron, operating pressure of 0.1-0.3 MPa, filtration area of 200-250 square meters to achieve a design recovery of >95% with clean feedwater.
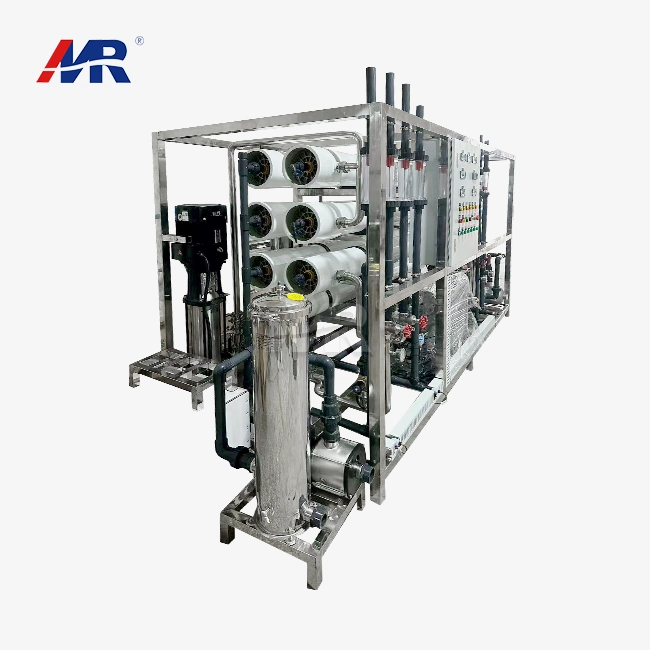
Morui has more than 14 branches with over 500 people and 20 engineers on the technical team, and we have many equipment processing facilities besides our membrane factory. We also act as an agent for Shimge water pumps, Runxin valves, and Createc instrumentation, which means we can create whole skids without having to chase parts from new companies. PLC control handles automation with optional remote monitoring, so operators can monitor TMP, flow, and turbidity from a phone or laptop. The modular skid design also allows for capacity increase later without rebuilding the whole system.
Procurement, Documentation, and Commercial Factors
Put these commercial elements in writing before you place the purchase so you don’t leave anything out at contract stage.
- Check the needed MOQ (minimum order quantity) or minimum project size since some providers have a floor for bespoke membrane orders.
- Request a clear production and commissioning lag time – not a total figure, but individual milestones.
- Verify payment terms and milestone structure and the Incoterm utilized (e.g. EXW, FOB, CIF, or DAP). Understand who bears the risk in shipping.
- Review the warranty length and exclusions, especially concerning membrane life and consumables like seals and filter cartridges.
- Ask for the complete list of spare parts, including suggested initial stock, the drawings, manuals, and software backup for local maintenance.
Confirm FAT (factory acceptance test) and SAT (site acceptance test) processes and local electrical voltage, frequency, and language requirements for the control panel.
Conclusion
While a 50m3/hour ultrafiltration plant typically achieves realistic recovery rates of 85–95%, the correct goal for your project will depend on the sum of feedwater quality, pretreatment, membrane flux, backwash design, and cleaning losses. The design-sheet number and the field number are seldom identical, and that gap is precisely what this essay has sought to bridge.
But before selecting a system, verify if the claimed 50m3/hour number is for feed or permeate capacity, request a seasonal feedwater study rather than a single sample, and ask your provider in writing to distinguish gross from net recovery. Compare UF to multimedia, microfiltration, and RO depending on the real impurities in your water, not some general brochure comparison. Require a documented water balance test and membrane specification sheet and explicit acceptance conditions before final payment. Choose a recovery goal that will keep the membranes alive for years, not simply one that appears nice in a single test run.
FAQ
1. What is the typical recovery rate of a 50m³/hour ultrafiltration plant?
A typical practical recovery rate runs approximately 85–95%. Good-quality groundwater may reach higher recovery, while difficult surface water often settles closer to 80–90% once backwash and cleaning losses are counted.
2. How much feedwater does a 50m³/hour UF plant require?
At 90% recovery, a plant producing 50m³/hour of permeate needs approximately 55.6m³/hour of feedwater. The exact number shifts based on backwash frequency, cleaning cycles, and other operating losses at your specific site.
3. Can a 50m³/hour UF plant treat well water?
Yes. UF treats well water well once suspended solids, iron, manganese, oil, hardness, and other dissolved substances are properly assessed first. Oxidation, filtration, softening, activated carbon, or RO may still be needed for specific dissolved contaminants.
4. Is UF recovery higher than RO recovery?
UF often reaches higher recovery because it does not generate the same concentrated dissolved-solids reject stream that RO produces. UF still loses water through backwashing, chemically enhanced cleaning, CIP, and flushing cycles, just at a smaller scale than RO concentrate.
5. Does ultrafiltration remove dissolved salts?
No. Standard UF does not reliably remove dissolved salts, hardness, or most low-molecular-weight dissolved contaminants. Reverse osmosis, ion exchange, or another dedicated treatment step handles those contaminants instead.
6. What membrane pore size is used in a 50m³/hour UF plant?
UF membrane pore size commonly falls between 0.01 and 0.1 microns. The exact specification depends on target contaminants, membrane material, module design, and the validation data behind the chosen membrane.
7. What standards should be checked before purchasing a UF plant?
Check applicable ISO quality management certificates, electrical and machinery compliance, CE marking where relevant, and RoHS or REACH documentation for electronic and chemical components. NSF/ANSI 61 or local drinking-water regulations matter most for potable-water projects (NSF International, 2024).
Ready to Review Your Water Treatment Project
Water projects rarely fail because the membrane was wrong. They fail because the feedwater data, the recovery target, and the site conditions never got matched up before the order was placed. My team at Morui reviews raw water reports, seasonal variation, and site layout before recommending a final recovery target for any 50m3/hour ultrafiltration plant quote we send out. If you are comparing suppliers for a municipal, industrial, or OEM project, send your feedwater analysis and flow requirements to benson@guangdongmorui.com, and our engineering team will prepare a process flow diagram and recovery calculation specific to your site, not a copy-paste version from another country.
References
1. U.S. Environmental Protection Agency, Membrane Filtration Guidance Manual, 2024 update, https://www.epa.gov/sites/default/files/2015-06/documents/membrane-filtration-guidance-manual.pdf — cited in the UF working principle and process flow section.
2. NSF International, NSF/ANSI/CAN 61: Drinking Water System Components — Health Effects, 2024, https://www.nsf.org/knowledge-library/nsf-ansi-can-61-drinking-water-system-components — cited in the FAQ section on purchasing standards.
3. International Organization for Standardization, ISO 9001:2015 Quality Management Systems — Requirements, https://www.iso.org/standard/62085.html — cited in the supplier evaluation section.
4. ASTM International, ASTM D6908-19: Standard Practice for Integrity Testing of Water Filtration Membrane Elements, https://www.astm.org/d6908-19.html — cited in the verification and acceptance test method section.
5. European Union, Directive (EU) 2020/2184 on the Quality of Water Intended for Human Consumption, https://eur-lex.europa.eu/legal-content/EN/TXT/?uri=CELEX%3A32020L2184 — cited in the drinking-water quality discussion under pretreatment.
6. Water Environment Federation, Membrane Filtration Technical Guidance, https://www.wef.org/resources/publications/ — cited in the UF versus conventional filtration comparison section.
About the Author
Shihai Su is Senior Overseas Water Treatment Technical Manager at Guangdong Morui Environmental Technology Co., Ltd. He has spent over a decade working on membrane filtration, RO pretreatment, and desalination projects across Southeast Asia, Africa, and Latin America, covering everything from village drinking water schemes to industrial wastewater reuse plants. His work focuses on matching membrane design to real site conditions rather than standard catalog specifications, drawing on direct commissioning and field service experience at over 100 installed systems.