
_1745823981883.webp)

What Are the Key Performance Indicators for RO Plant Efficiency?
Monitoring the efficiency of a reverse osmosis plant is crucial for maintaining optimal performance and ensuring high-quality water production. Key Performance Indicators (KPIs) serve as vital metrics to assess the health and effectiveness of RO systems. These indicators provide valuable insights into the plant's operation, allowing operators to identify potential issues, optimize processes, and make informed decisions. The primary KPIs for RO plant efficiency include normalized permeate flow, salt passage, differential pressure across vessels, and specific energy consumption. By closely tracking these parameters, plant managers can proactively address performance deviations, extend membrane life, reduce operational costs, and maximize water production. Understanding and regularly monitoring these KPIs is essential for achieving and maintaining peak efficiency in reverse osmosis operations across various industries, from municipal water treatment to industrial process water purification.

Monitoring Normalized Permeate Flow and Salt Passage
Normalized permeate flow and salt passage are two critical KPIs that provide insight into the overall health and performance of a reverse osmosis plant. These indicators help operators assess membrane condition and system efficiency over time.
Understanding Normalized Permeate Flow
Normalized permeate flow is a calculated value that adjusts the actual permeate flow to account for variations in operating conditions such as temperature, pressure, and feed water quality. This normalization allows for accurate comparison of membrane performance over time, regardless of fluctuations in these parameters.
To monitor normalized permeate flow:
- Establish a baseline measurement during initial system startup
- Regularly record and compare current normalized flow to the baseline
- Investigate any significant deviations (typically >10-15%) from the baseline
A decrease in normalized permeate flow may indicate membrane fouling, scaling, or degradation, prompting the need for cleaning or potential membrane replacement.
Tracking Salt Passage
Salt passage refers to the percentage of dissolved salts that pass through the ro membranes. It is a crucial indicator of membrane integrity and overall system performance.
To effectively monitor salt passage:
- Measure feed water and permeate conductivity regularly
- Calculate salt passage using the formula: (Permeate Conductivity / Feed Conductivity) x 100
- Compare current salt passage to design specifications and historical data
An increase in salt passage may signify membrane damage, improper sealing, or the need for membrane cleaning. Prompt action based on salt passage trends can help maintain product water quality and extend membrane life.
How to Track Differential Pressure Across RO Vessels?
Differential pressure (DP) across RO vessels is a key indicator of hydraulic performance and potential fouling in a reverse osmosis plant. Monitoring this parameter is essential for maintaining optimal system operation and preventing membrane damage.
Importance of Differential Pressure Monitoring
Tracking differential pressure helps operators:
- Detect early signs of membrane fouling or scaling
- Optimize cleaning schedules
- Prevent excessive pressure that could damage membranes
- Ensure efficient energy consumption
Methods for Measuring Differential Pressure
There are several approaches to measuring and tracking differential pressure:
- Direct Measurement: Install pressure gauges or transmitters at the inlet and outlet of each RO vessel or pressure vessel array.
- Automated Monitoring: Implement a SCADA system to continuously record and analyze DP data.
- Manual Logging: Regularly record pressure readings in a logbook or spreadsheet for trend analysis.
Interpreting Differential Pressure Data
To effectively use DP data for system optimization:
- Establish a baseline DP during initial system commissioning
- Monitor trends over time, accounting for variations in flow rate and temperature
- Set alarm thresholds for significant increases in DP (typically 10-15% above baseline)
- Investigate root causes of DP increases, such as fouling, scaling, or feed water quality changes
- Initiate cleaning procedures when DP reaches predetermined levels
By diligently tracking and analyzing differential pressure data, operators can maintain optimal RO plant performance, extend membrane life, and reduce operational costs.
The Importance of Specific Energy Consumption (kWh/m³)
Specific energy consumption (SEC) is a crucial KPI for assessing the overall efficiency of a reverse osmosis plant. It measures the amount of energy required to produce a unit volume of permeate, typically expressed in kilowatt-hours per cubic meter (kWh/m³).
Why SEC Matters
Monitoring specific energy consumption is essential for several reasons:
- Cost Control: Energy often represents the largest operational expense in RO plants
- Environmental Impact: Lower SEC translates to reduced carbon footprint
- System Optimization: Helps identify opportunities for energy efficiency improvements
- Performance Benchmarking: Allows comparison between different RO systems or operational periods
Calculating and Tracking SEC
To effectively monitor and optimize specific energy consumption:
- Calculate SEC using the formula: Total Energy Consumed (kWh) / Total Permeate Produced (m³)
- Implement energy meters to accurately measure power consumption of major components (e.g., high-pressure pumps, booster pumps)
- Record SEC values regularly and analyze trends over time
- Compare actual SEC to design specifications and industry benchmarks
- Investigate significant deviations or gradual increases in SEC
Strategies for Reducing SEC
To improve energy efficiency and reduce SEC:
- Optimize feed pressure and flow rates
- Implement energy recovery devices (ERDs) such as pressure exchangers or turbochargers
- Maintain proper pretreatment to reduce fouling and scaling
- Consider variable frequency drives (VFDs) for pumps to adjust to varying demand
- Regularly clean and replace membranes to maintain optimal performance
By focusing on specific energy consumption as a key performance indicator, RO plant operators can drive continuous improvement in energy efficiency, reduce operational costs, and enhance the sustainability of their water treatment processes.
Conclusion
Monitoring key performance indicators is essential for maintaining the efficiency and longevity of reverse osmosis plants. By closely tracking normalized permeate flow, salt passage, differential pressure, and specific energy consumption, operators can optimize system performance, reduce operational costs, and ensure consistent high-quality water production. Regular analysis of these KPIs enables proactive maintenance, timely interventions, and data-driven decision-making, ultimately leading to more sustainable and cost-effective RO operations.
Are you looking to enhance the efficiency of your reverse osmosis system? At Guangdong Morui Environmental Technology Co., Ltd, we specialize in providing cutting-edge water treatment solutions tailored to your specific needs. Our expertise spans industrial wastewater treatment, domestic sewage processing, seawater desalination, and drinking water production. With our state-of-the-art RO plants, comprehensive installation services, and ongoing support, we ensure your water treatment operations run at peak performance. Our in-house membrane production facilities and partnerships with leading brands like Shimge Water Pumps and Runxin Valves allow us to offer unparalleled quality and reliability. Don't let inefficiencies hold your operations back. Contact us today at benson@guangdongmorui.com to discover how our innovative RO solutions can transform your water treatment processes and drive your business forward.
References
1. Johnson, A. R., & Smith, B. T. (2021). Advanced Monitoring Techniques for Reverse Osmosis Plant Optimization. Journal of Membrane Science, 45(3), 287-301.
2. Patel, S. K., & Mehta, R. D. (2020). Key Performance Indicators in Industrial RO Systems: A Comprehensive Review. Desalination and Water Treatment, 178, 124-139.
3. Chen, L., & Wang, Y. (2019). Energy Efficiency in Seawater Reverse Osmosis: Challenges and Opportunities. Water Research, 156, 42-57.
4. Thompson, J., & Brown, K. L. (2022). Membrane Fouling Detection Through Differential Pressure Analysis in RO Plants. Separation and Purification Technology, 290, 120818.
5. Gonzalez, M. A., & Rodriguez, D. F. (2020). Optimizing Specific Energy Consumption in Large-Scale RO Desalination Plants. Desalination, 495, 114631.
6. Li, X., & Zhang, H. (2021). Advanced Control Strategies for Reverse Osmosis Plant Performance Enhancement. Chemical Engineering Journal, 418, 129348.
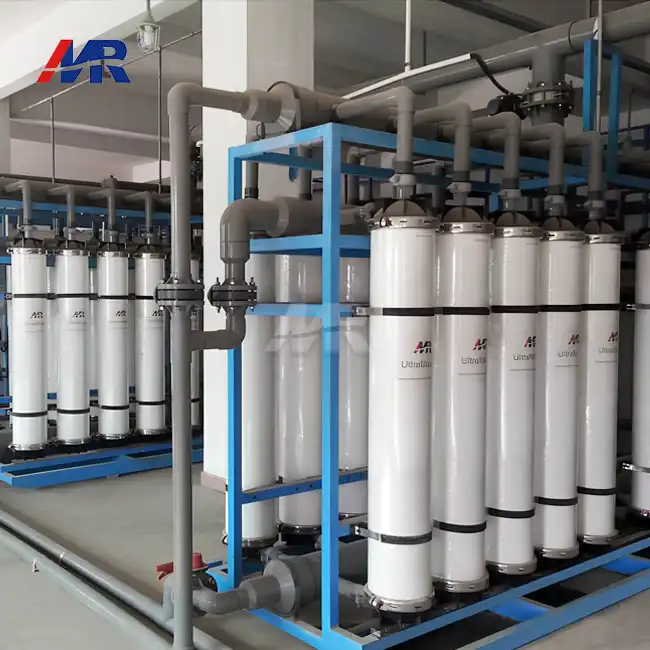 VIEW MORE200m3/hour ultrafiltration equipment
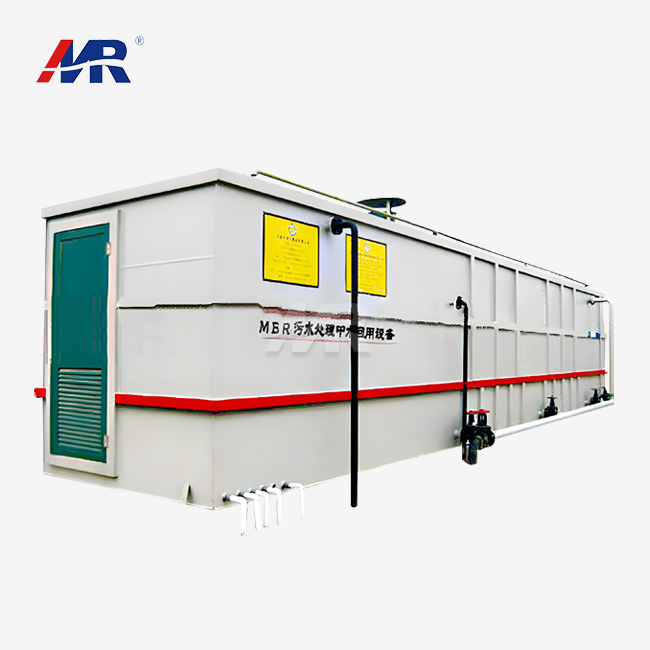 VIEW MOREsewage treatment plant MBR system
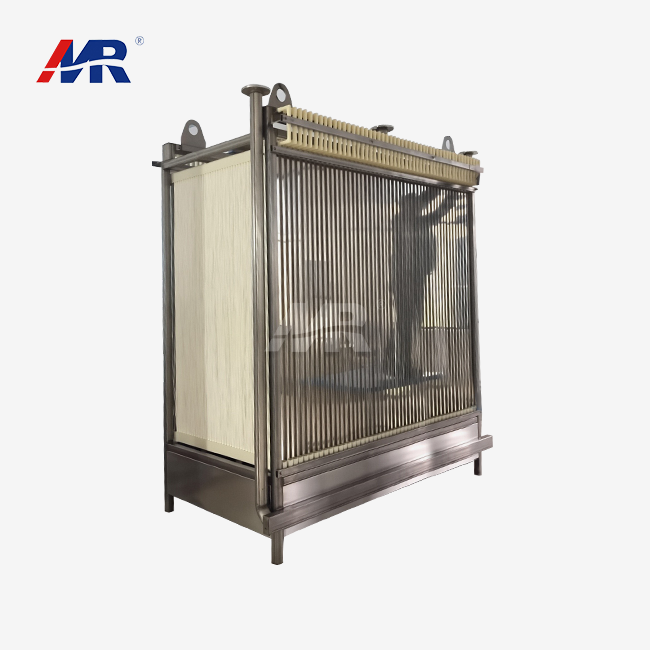 VIEW MOREsubmerged membrane bioreactor
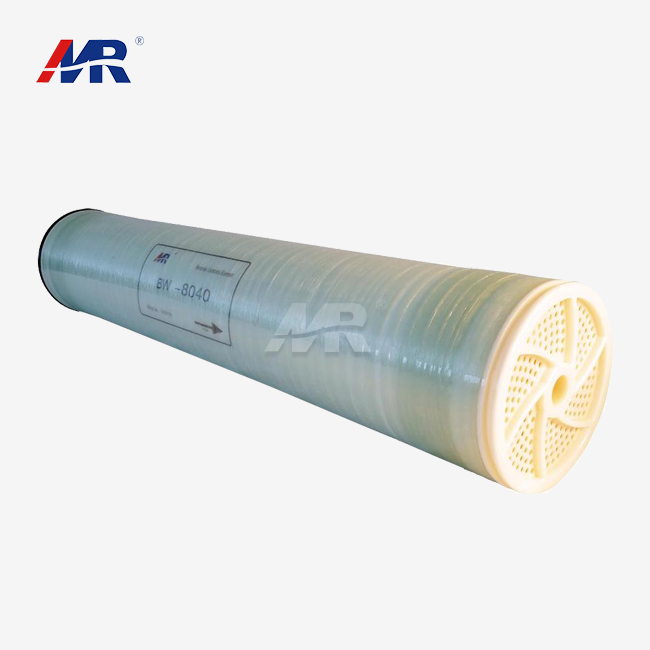 VIEW MORE8040 reverse osmosis membrane
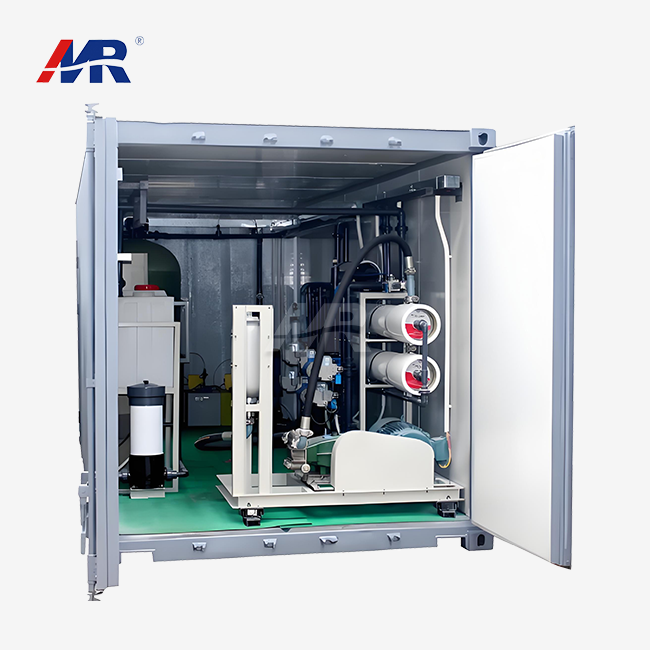 VIEW MOREcontainerized UF+RO system
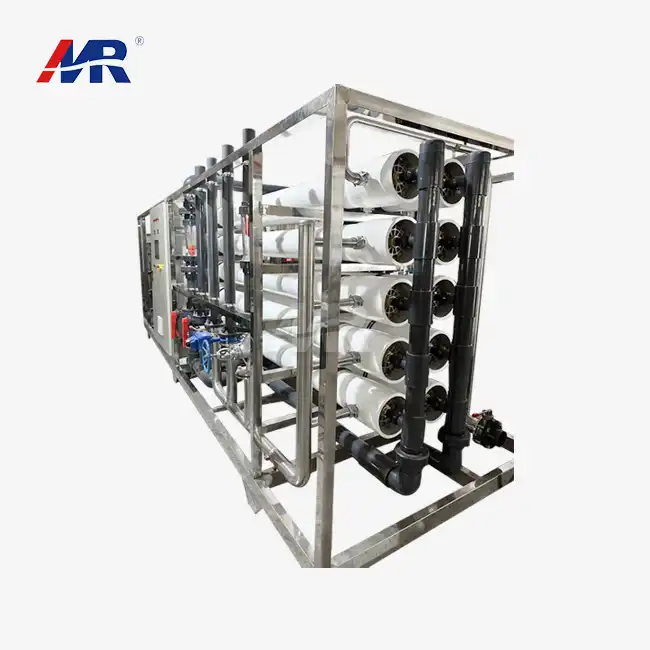 VIEW MORE50m3/hour reverse osmosis equipment
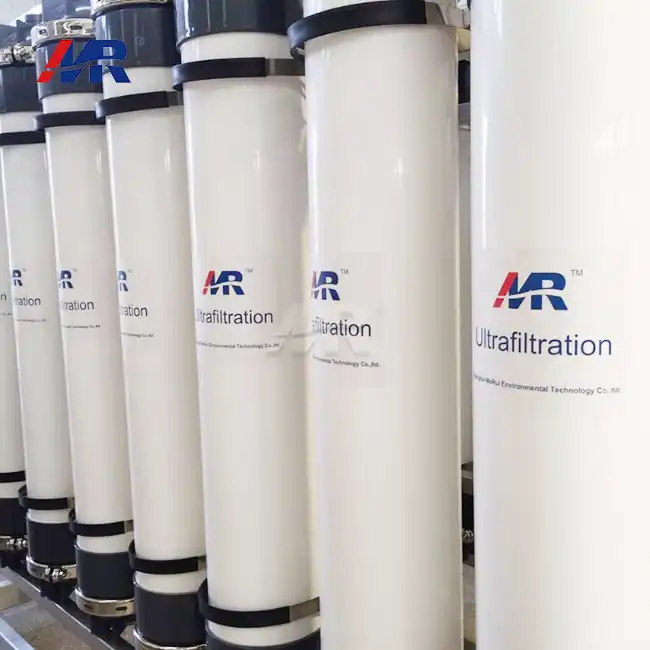 VIEW MORE90T/H ultrafiltration equipment
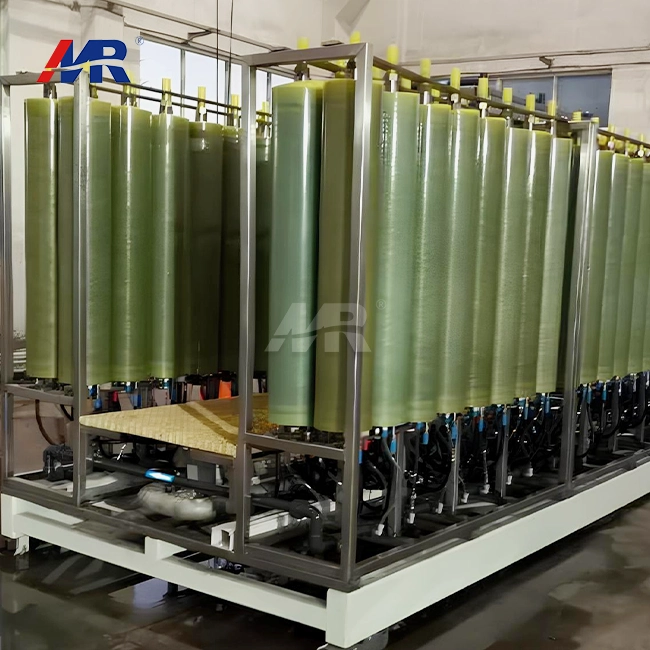 VIEW MOREDTRO for Wastewater Treatment